. 2023 Apr 22;80(5):129.
doi: 10.1007/s00018-023-04778-9.

A neuroprotective role of Ufmylation through Atg9 in the aging brain of Drosophila

Affiliations

A neuroprotective role of Ufmylation through Atg9 in the aging brain of Drosophila

Huifang Li et al. Cell Mol Life Sci. .

Abstract

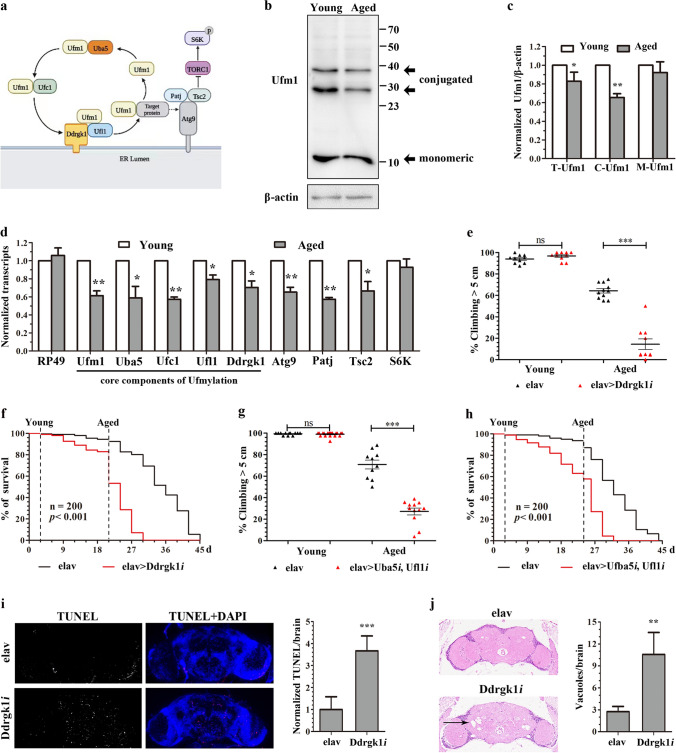
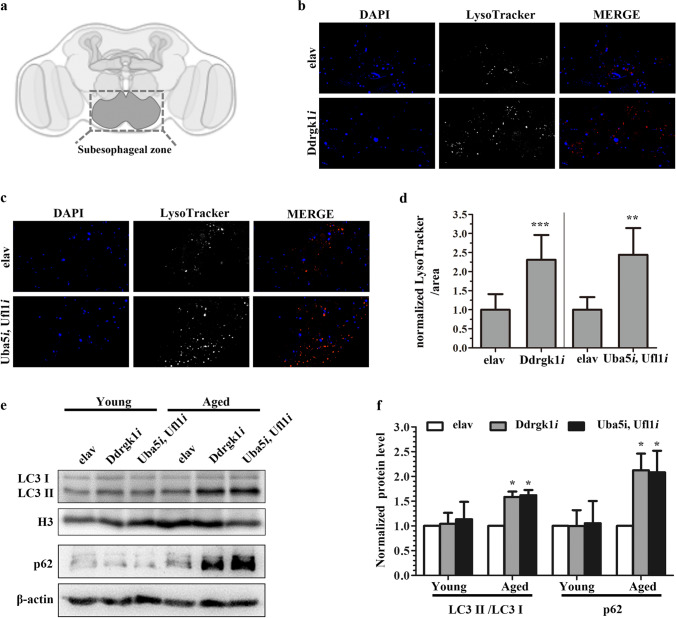
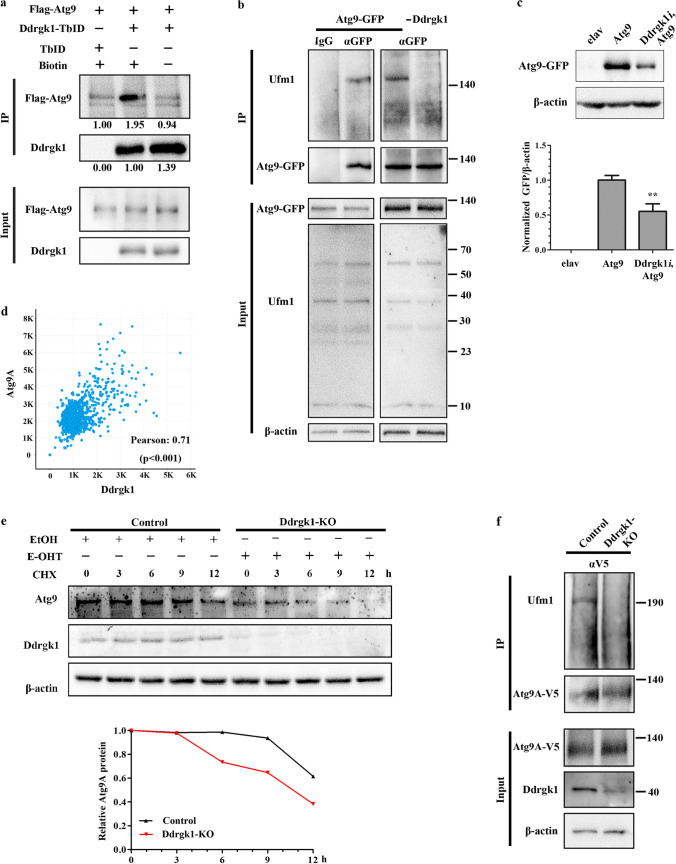
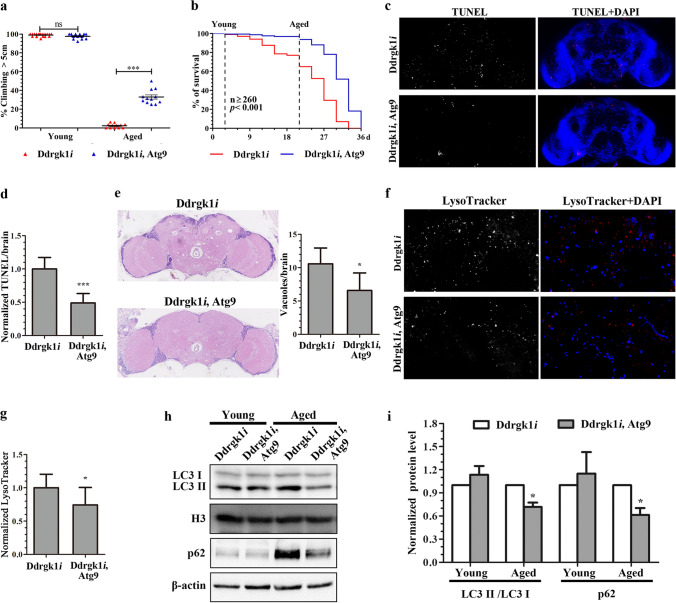
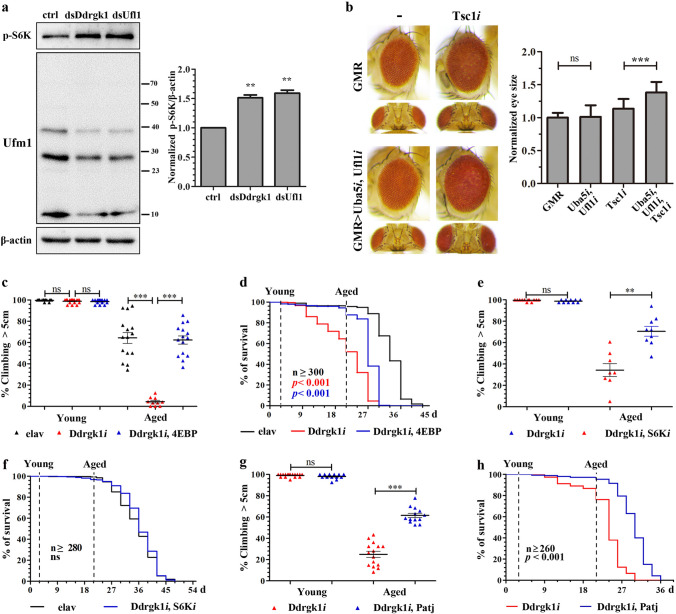
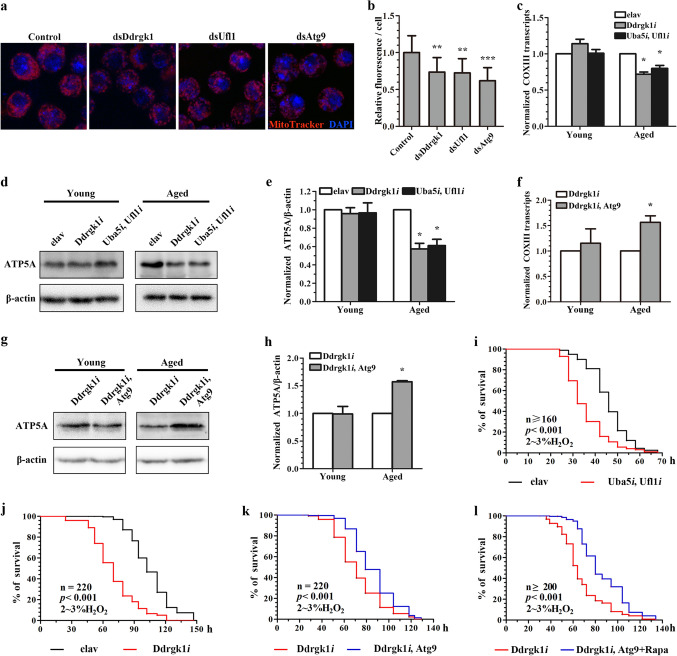
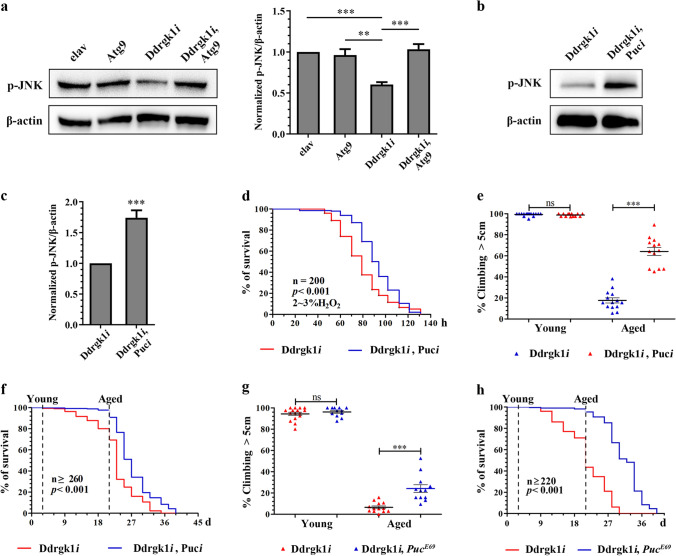
Ufmylation is a recently identified small ubiquitin-like modification, whose biological function and relevant cellular targets are poorly understood. Here we present evidence of a neuroprotective role for Ufmylation involving Autophagy-related gene 9 (Atg9) during Drosophila aging. The Ufm1 system ensures the health of aged neurons via Atg9 by coordinating autophagy and mTORC1, and maintaining mitochondrial homeostasis and JNK (c-Jun N-terminal kinase) activity. Neuron-specific expression of Atg9 suppresses the age-associated movement defect and lethality caused by loss of Ufmylation. Furthermore, Atg9 is identified as a conserved target of Ufm1 conjugation mediated by Ddrgk1, a critical regulator of Ufmylation. Mammalian Ddrgk1 was shown to be indispensable for the stability of endogenous Atg9A protein in mouse embryonic fibroblast (MEF) cells. Taken together, our findings might have important implications for neurodegenerative diseases in mammals.

Keywords: Life span; Oxidative stress; Patj; Puc; Uba5; Ufl1.


Conflict of interest statement

The authors declare no competing interests.

Figures

Fig. 1
Fig. 1
Characterization of Ufmylation in the aging brain of adult Drosophila. a The Ufmylation system and Atg9 regulation shown in relation to the ER. b Ufmylation in the brains of young (3-day-old) and aged (30-day-old) w1118 control male flies. Conjugated and monomeric Ufm1 proteins are indicated by arrowheads. Anti-β-actin was used as loading control. c Histogram showing the normalized ratio to β-actin of total Ufm1 (T-Ufm1), conjugated Ufm1 (C-Ufm1) and monomeric Ufm1 (M-Ufm1) protein in young and aged fly brains. Data represent the average ± SD for 3 independent experiments. *p < 0.05, **p < 0.01. d Normalized mRNA levels of indicated genes measured by quantitative RT-PCR. RNA was isolated from abovementioned young and aged w1118 male adult heads. RNA levels were normalized to kinesin mRNA. Data represent the average ± SD of 3 independent experiments. *p < 0.05, **p < 0.01. e Climbing assays show the percentage of flies that climbed > 5 cm in 30 s. UAS-Ddrgk1RNAi (NIG) was expressed in neurons with the elav-Gal4 driver. “elav” denotes elav-Gal4/ + by crossing with w1118. ns not significant, ***p < 0.001. f Adult lifespan calculated by day at 29 °C. Broken lines indicate the time points aged at 29 °C when climbing assays in (e) were performed. n = 200 flies per genotype; Log-rank test, p < 0.001. g Climbing assays for pan-neuronal expression of UAS-Uba5RNAi and UAS-Ufl1RNAi. ns not significant, ***p < 0.001. h Adult lifespan at 29 °C. Broken lines indicate the time points when climbing assays in (g) were performed. n = 200 flies per genotype; Log-rank test, p < 0.001. i Left panel: TUNEL staining in aged (21-day-old) brains. elav-Gal4 was used to drive UAS-RNAi transgene for Ddrgk1. Cell apoptosis was indicated by fragmented DNA as labeled by TUNEL in red. Nuclei were labeled with DAPI (blue). Right panel: normalized ratio of TUNEL dots in each brain (n ≥ 6). ***p < 0.001. j Left panel: neuropil vacuolization (arrowhead) in hematoxylin and eosin-stained brain sections of aged (21-day-old) flies. Right panel: quantification of vacuoles in each brain (n ≥ 7). **p < 0.01
Fig. 2
Fig. 2
Loss of Ufmylation led to lysosomal-autophagic deficits. a Diagram of a fly brain with the sub-esophageal zone highlighted. b Brains dissected from aged (21-day-old) elav-Gal4 control or Ddrgk1 knockdown flies were stained with LysoTracker Red. Images were captured from the same region of the sub-esophageal ganglion in each brain using the same microscope settings. DAPI was used to visualize nuclei (blue). c Brains dissected from aged (24-day-old) Uba5 and Ufl1 knockdown flies were stained with LysoTracker Red. Images were captured from the same region of the sub-esophageal ganglion. d LysoTracker probes above a uniform threshold were counted. Values represent average ± SD for n ≥ 7 experiments with one control and one knockdown brain in each experiment. The normalized ratio between control and Ddrkg1 knockdown (left) is 1/2.31. **p < 0.01, ***p < 0.001. e Immunoblots to visualize the levels of LC3 (LC3-I and LC3-II) and p62 in young (3-day-old) and aged (24-day-old) heads from flies expressing UAS-Ddrgk1RNAi and UAS-Uba5RNAi, UAS-Ufl1RNAi under elav-Gal4 control. Antibody to H3 and β-actin were used as loading controls. f Histogram showing the normalized levels of LC3-II/LC3-I and p62 for representative lanes in (e). Data represent the average ± SD for 3 independent experiments. *p < 0.05 when comparing to the control
Fig. 3
Fig. 3
Ddrgk1 mediates Atg9 Ufmylation and stabilizes its proteins. a Immunoblots to monitor the transient interaction between Ddrgk1-TurboID-V5 and Flag-Atg9. S2 cells were transfected to express TurboID-V5 or Ddrgk1-TurboID-V5 with Flag-Atg9. Cells were treated with biotin or water as a control (-) as indicated. Biotin-labeled proteins were recovered using Streptavidin beads, and blots were probed with anit-V5 and anti-Flag to visualize Ddrgk1 and bound Atg9. Relative protein levels were quantified and calculated for representative lanes. b Immunoblots to monitor Ufmylation of Atg9-GFP expressed under elav-Gal4 control in aged (21-day-old) fly heads. Left panel: Atg9-GFP proteins were recovered using GFP antibody raised in Alpaca, and blots were probed with anti-Ufm1 to visualize Ufmylation. Alpaca IgG was used as a control. Right panel: Atg9-GFP proteins were recovered from aged heads expressing UAS-Ddrgk1RNAi under elav-Gal4 control. Anti-β-actin was used as loading control. c Immunoblots to visualize the level of GFP tagged Atg9 expressed in 21-day-old fly brains with and without Ddrgk1 depletion. Lower panel: histogram showing the normalized ratio of GFP/β-actin indicated for representative lanes in upper panel. Data represent 3 independent experiments. **p < 0.01. d Correlation analysis of Ddrgk1 versus Atg9A in 7255 human samples from 6805 patients with tumors in CNS/brain using cBioPortal (www.cbioportal.org). Pearson correlation coefficient rho = 0.71 (p < 0.001). e Upper panel: immunoblots to visualize the levels of endogenous Atg9A and Ddrgk1 in MEF cells harvested from the Ddrgk1F/F:ROSA26-CreERT2 mice. MEFs were treated with 4-OHT or ethanol to induce Ddrgk1 deletion or as a control. Before harvested, MEFs were pretreated with cycloheximide (CHX) for the indicated times. Anti-β-actin was used as loading control. Lower panel: histogram showing the quantification of Atg9A levels normalized to β-actin. f Immunoblots to monitor Ufmylation of Atg9A-V5. MEFs were treated with 4-OHT to induce Ddrgk1 deletion. Atg9A-V5 proteins were recovered using V5 antibody from MEFs transfected to express Atg9A-V5. Blot was probed with anti-Ufm1 to visualize Atg9A Ufmylation. Anti-β-actin was used as loading control
Fig. 4
Fig. 4
Atg9 is involved in the neuroprotection of Ufmylation. a Climbing assay performed on Ddrgk1 knockdown and Atg9 co-expression flies under elav-Gal4 control. ns not significant, ***p < 0.001. b Adult lifespan of Ddrgk1 knockdown flies calculated by day at 29 °C with and without co-expression of Atg9. n ≥ 260 flies per genotype; Log-rank test, p < 0.001. c TUNEL staining in aged (21-day-old) brains of Ddrgk1 knockdown and Atg9 co-expression flies. Cell apoptosis was indicated by TUNEL in red and nuclei were labeled with DAPI in blue. d normalized ratio of TUNEL dots in each brain (n ≥ 6). ***p < 0.001. e Left panel: neuropil vacuolization in HE-stained brain sections of aged (21-day-old) flies with denoted genotypes. Right panel: quantification of vacuoles in each brain (n ≥ 6). *p < 0.05. f Aged (21-day-old) brains from Ddrgk1 knockdown flies with and without Atg9 co-expression were stained with LysoTracker Red. DAPI was used to visualize nuclei (blue). Images were captured from the same region of the sub-esophageal ganglion. g LysoTracker probes above a uniform threshold were counted. The normalized ratio is 1/0.74 for n = 7 when comparing Ddrgk1 knockdown with Atg9 co-expression. *p < 0.05. h Immunoblots to visualize the levels of LC3 and p62 in young (3-day-old) and aged (21-day-old) heads from Ddrgk1 knockdown flies with and without Atg9 co-expression. Antibody to H3 and β-actin were used as loading controls. i Histogram showing the normalized levels of LC3-II/LC3-I and p62 for representative lanes in (h). Data represent the average ± SD for 3 independent experiments. *p < 0.05
Fig. 5
Fig. 5
Ufmylation acts via Atg9 to regulate mTORC1 activity. a Left panel: immunoblots to detect S6K phosphorylation. S2 cells were treated with dsRNA to deplete Ddrgk1 or Ufl1. Efficacy of Ddrgk1 or Ufl1 depletion was monitored indirectly by Ufm1 antibody. Anti-β-actin was used as loading control. Right panel: histogram showing the normalized ratio of p-S6K/β-actin indicated for representative lanes in left panel. Data represent 3 independent experiments. **p < 0.01. b Photomicrographs of adult eyes expressing GMR-Gal4 alone or with UAS-Uba5RNAi and UAS-Ufl1RNAi. Middle panel: co-expressed UAS-Tsc1RNAi. Right panel: normalized eye size measured in pixels from digital images using ImageJ. Error bars indicate SD from measurement of at least 15 eyes for each genotype. ns not significant, ***p < 0.001. c Climbing assay performed on Ddrgk1 knockdown and 4EBP co-expression flies under elav-Gal4 control; e Climbing assay performed on S6KRNAi co-expression; g Climbing assay performed on Patj overexpression flies. ns not significant, **p < 0.01, ***p < 0.001. d Adult lifespan of Ddrgk1 knockdown and 4EBP co-expression flies. n ≥ 300 flies; p < 0.001 (in red) when comparing Ddrgk1 knockdown with elav-Gal4 control; p < 0.001 (in blue) when comparing Ddrgk1 knockdown with 4EBP co-expression. f Adult lifespan by day at 29 °C. n ≥ 280 flies; ns not significant when comparing elav control with Ddrgk1 and S6K double knockdown. h Adult lifespan of Ddrgk1 knockdown flies with and without Patj overexpression. n ≥ 260 flies, p < 0.001. Broken lines indicate the time points aged at 29 °C when climbing assays were performed
Fig. 6
Fig. 6
Ufmylation acts via Atg9 to regulate mitochondrial homeostasis. a Visualization of active mitochondria by MitoTracker Red. S2 cells were treated with dsRNA to deplete Ddrgk1, Ufl1 or Atg9. DAPI was used to visualize nuclei (blue). b MitoTracker signals were measured as pixel intensity for each cell. Values represent average ± SD for n = 50 cells per treatment. **p < 0.01, ***p < 0.001 comparing to the control. c Histogram showing the level of mitochondrial COXIII mRNAs measured by quantitative RT-PCR. Total RNA was extracted from young (3-day-old) and aged (24-day-old) fly heads with indicated genotypes under elav-Gal4 control. RNA levels were normalized to age-matched elav control after normalized to kinesin mRNA. Values represent average ± SD for 3 biological replicates. *p < 0.05 when comparing to elav control. d Immunoblots to visualize the level of mitochondrial ATP5A in young (3-day-old) and aged (24-day-old) heads from flies of denoted genotypes. Anti-β-actin was used as loading control. e Histogram showing the normalized ratio of ATP5A/β-actin indicated for representative lanes in (d). Data represent 3 independent experiments. *p < 0.05 when comparing to elav. f COXIII mRNAs measured by quantitative RT-PCR. Total RNA was extracted from young (3-day-old) and aged (21-day-old) fly heads with indicated genotypes. RNA levels were normalized to age-matched Ddrgk1 RNAi flies. Values represent average ± SD for 3 biological replicates. *p < 0.05. g Immunoblots to visualize the level of ATP5A in young (3-day-old) and aged (21-day-old) heads of denoted genotypes. h Normalized ratio of ATP5A/β-actin indicated for representative lanes in (g). *p < 0.05. il Survival curve of young flies of denoted genotypes fed with H2O2 to induce oxidative stress at 25 °C: i 5-day-old flies expressing UAS-RNAi transgene for Uba5 and Ufl1, n ≥ 160, p < 0.001 (Log-rank test); j 3-day-old flies expressing Ddrgk1 RNAi under elav-Gal4, n = 220, p < 0.001; k Co-expression of Atg9 in Ddrgk1 knockdown flies (3-day-old), n = 220, p < 0.001; l flies in (k) reared on medium supplemented with 100 µM Rapamycin (Rapa), n ≥ 200, p < 0.001
Fig. 7
Fig. 7
JNK is involved in the neuroprotection of Ufmylation. a Immunoblot to detect JNK phosphorylation in heads of young flies (3-day-old) driven by elav-Gal4. Flies depleted Ddrgk1, or overexpressing Atg9, or both were treated with H2O2 at 25 °C for 60 h. Anti-β-actin was used as loading control. Right panel: histogram showing the normalized ratio of p-JNK/β-actin indicated for representative lanes in left panel. Data represent 3 independent experiments. **p < 0.01, ***p < 0.001. b Immunoblot to detect JNK phosphorylation in heads of 3-day-old elav flies depleted Ddrgk1 with or without Puc RNAi. Flies were treated with H2O2 at 25 °C for 60 h. c Histogram showing the ratio of p-JNK/β-actin for representative lanes in (b). ***p < 0.001 as per 3 repeats. d Survival curve on H2O2 of Ddrgk1 knockdown young flies (3-day-old) with or without Puc depletion by elav-Gal4. n = 200; Log-rank test, p < 0.001. e and g Climbing assays: e Ddrgk1 knockdown flies with or without Puc depletion; g Ddrgk1 knockdown by elav-Gal4 with one mutant copy of the Puc gene (PucE69 as indicated). ns not significant, ***p < 0.001. f and h Adult lifespan at 29 °C: f Ddrgk1 knockdown with or without Puc depletion, n ≥ 260, p < 0.001; h Ddrgk1 knockdown flies heterozygous for PucE69, n ≥ 220, p < 0.001. Broken lines indicate the time points when climbing assays were performed

Similar articles

Cited by

References

    1. Klionsky DJ, et al. Guidelines for the use and interpretation of assays for monitoring autophagy (3rd edition) Autophagy. 2016;12(1):1–222. doi: 10.1080/15548627.2015.1100356. - DOI - PMC - PubMed
    1. Lahiri V, Hawkins WD, Klionsky DJ. Watch what you (Self-) eat: autophagic mechanisms that modulate metabolism. Cell Metab. 2019;29(4):803–826. doi: 10.1016/j.cmet.2019.03.003. - DOI - PMC - PubMed
    1. Li H, Yu Z, Zhang W. Misfolded protein aggregation and altered cellular pathways in neurodegenerative diseases. STEMedicine. 2020;1(4):e63. doi: 10.37175/stemedicine.v1i4.63. - DOI
    1. Xi Y, Dhaliwal JS, Ceizar M, Vaculik M, Kumar KL, Lagace DC. Knockout of Atg5 delays the maturation and reduces the survival of adult-generated neurons in the hippocampus. Cell Death Dis. 2016;7:e2127. doi: 10.1038/cddis.2015.406. - DOI - PMC - PubMed
    1. Nowosad A, Besson A. Lysosomes at the crossroads of cell metabolism, cell cycle, and stemness. Int J Mol Sci. 2022;23(4):2290. doi: 10.3390/ijms23042290. - DOI - PMC - PubMed

MeSH terms