. 2023 May 2;35(5):807-820.e5.
doi: 10.1016/j.cmet.2023.03.015. Epub 2023 Apr 21.

Biological age is increased by stress and restored upon recovery

Affiliations

Biological age is increased by stress and restored upon recovery

Jesse R Poganik et al. Cell Metab. .

Abstract

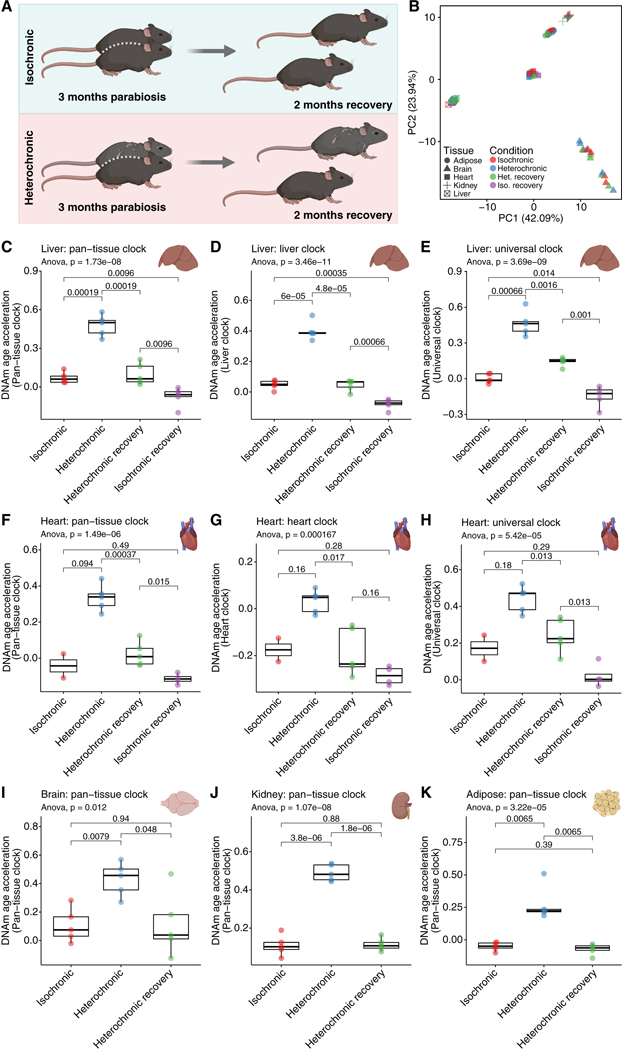
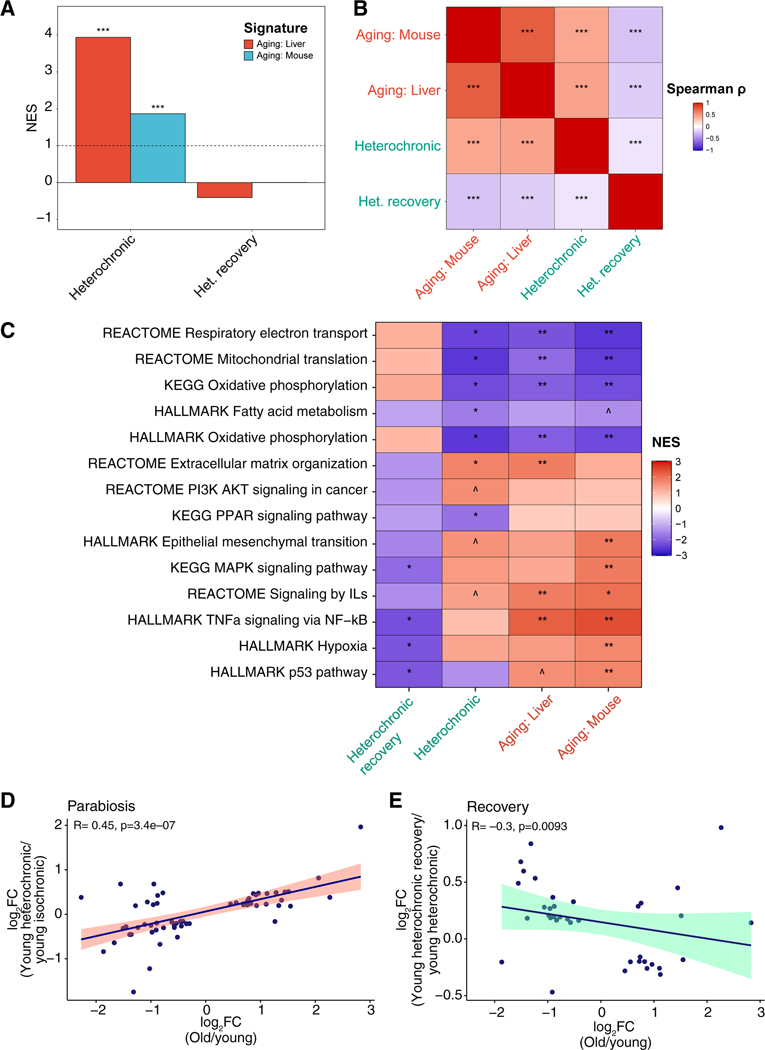
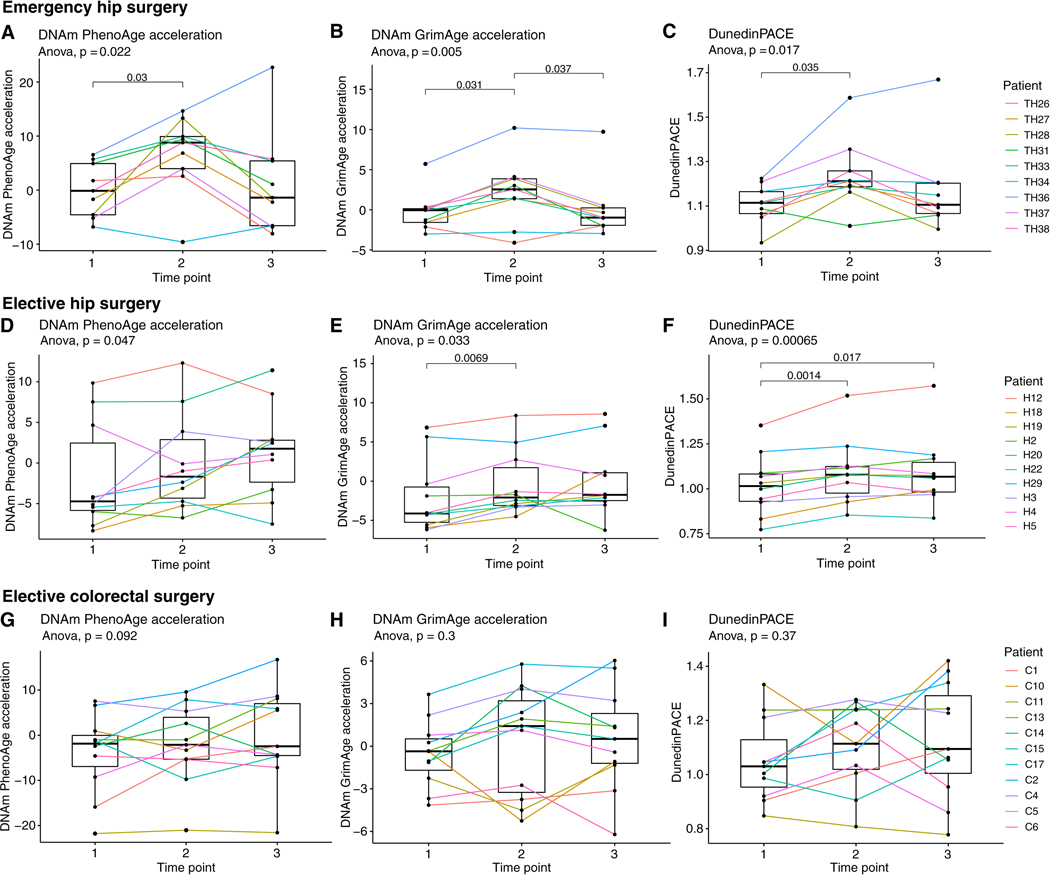
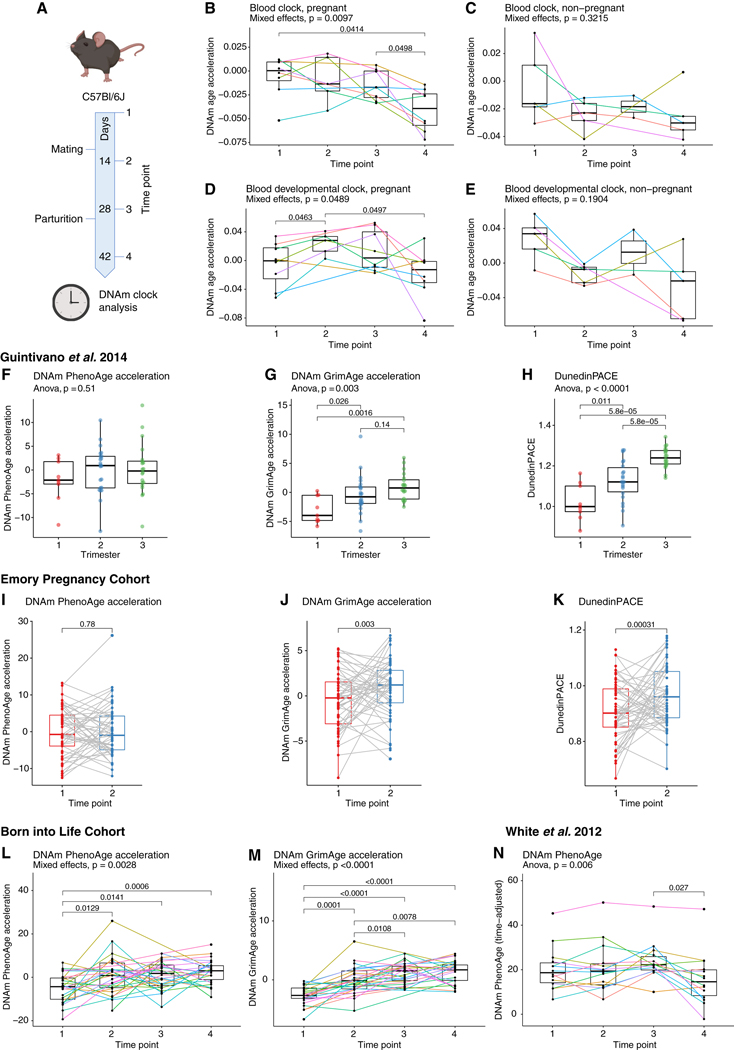
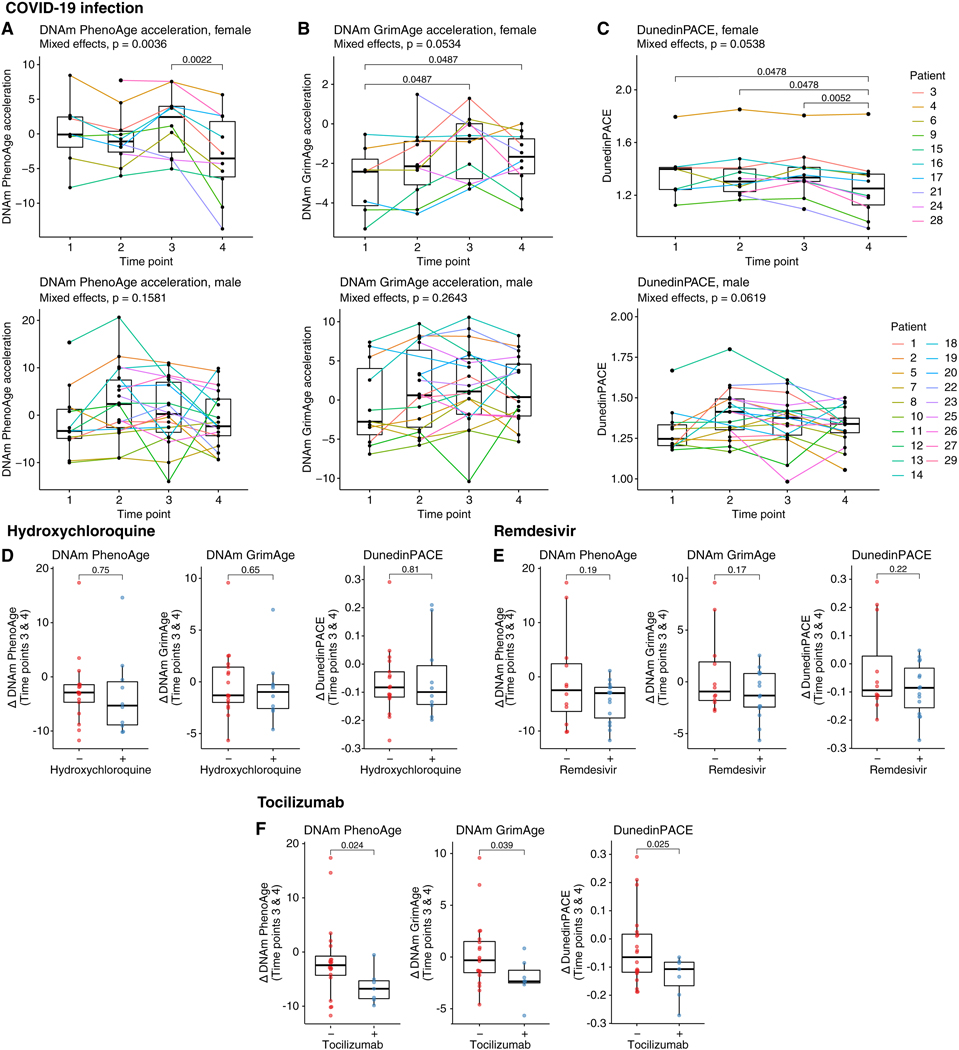
Aging is classically conceptualized as an ever-increasing trajectory of damage accumulation and loss of function, leading to increases in morbidity and mortality. However, recent in vitro studies have raised the possibility of age reversal. Here, we report that biological age is fluid and exhibits rapid changes in both directions. At epigenetic, transcriptomic, and metabolomic levels, we find that the biological age of young mice is increased by heterochronic parabiosis and restored following surgical detachment. We also identify transient changes in biological age during major surgery, pregnancy, and severe COVID-19 in humans and/or mice. Together, these data show that biological age undergoes a rapid increase in response to diverse forms of stress, which is reversed following recovery from stress. Our study uncovers a new layer of aging dynamics that should be considered in future studies. The elevation of biological age by stress may be a quantifiable and actionable target for future interventions.

Keywords: aging; biological age; dynamics; epigenetic aging clocks; recovery; stress.


Conflict of interest statement

Declaration of interests The authors declare no competing interests.

Figures

Figure 1.
Figure 1.. Young mice exposed to aged circulation undergo a reversible increase in biological age.
(A) Setup of parabiosis experiment. Young (3-month-old) mice were surgically joined with either another young mouse (isochronic) or an old (20-month-old) mouse (heterochronic) for 3 months. Following the parabiosis period, mice were separated and allowed to recover for a further 2 months. Tissues from young mice were analyzed using DNAm clocks to assess biological age. (B) Principal component analysis of methylation data across tissues. (C–E) DNAm age acceleration results for liver tissue from the HorvathMammalMethyl40 pan-tissue (C), liver (D), and universal pan-mammalian (E) clocks. (F–H) DNAm age acceleration results for heart tissue using the pan-tissue (F), heart (G), and universal pan-mammalian (H) clocks. (I–K) Pan-tissue clock DNAm age acceleration results from brain (I), kidney (J), and adipose (K) tissues. P values were calculated with ANOVA and unpaired t-tests. Sample sizes: C–E, n=6 for isochronic and isochronic recovery, and n=5 for heterochronic and heterochronic recovery. F–G, n=5 for heterochronic and heterochronic recovery, n=2 for isochronic, and n=4 for isochronic recovery; I–K, n= 5 for all conditions. See also Figure S1.
Figure 2.
Figure 2.. Heterochronic parabiosis reversibly perturbs biological age at the transcriptomic and metabolomic levels.
(A) Results of application of aging signatures to sequenced RNA isolated from livers of young heterochronic parabionts upon parabiosis (left) and recovery (right). (B) Correlation matrix between functions enriched upon heterochronic parabiosis/recovery and those enriched by signatures of aging. (C) As in B, but analyzed for enrichment at the pathway level. (D–E) Correlation of changes in age-related metabolites between aging and heterochronic parabiosis (D) or recovery (E). Correlation coefficients and p values were calculated with either Spearman correlation (A–C) or Kendall correlation (D–E). See also Figure S2.
Figure 3.
Figure 3.. Patients undergoing major emergency (but not elective) surgery experience a reversible increase in biological age.
(A–C) Second-generation DNAm age biomarkers for patients undergoing emergency surgery to repair traumatic hip fractures determined using DNAmPhenoAge (A), DNAmGrimAge (B), and DunedinPoAm38 (C). (D–F) As above, but for patients undergoing elective hip surgery. (G–I) As above, but for patients undergoing elective colorectal surgery. In all panels, time point 1 corresponds to immediately before surgery; time point 2 corresponds to the morning after surgery; and time point 3 corresponds to the day of discharge from the hospital, 4–7 days post-surgery. P values were calculated with repeated-measures ANOVA and paired t-tests. Sample sizes: A–C, n=9; D–F, n=10; G–I, n=11. See also Figure S3.
Figure 4.
Figure 4.. Mice and humans experience an increase in biological age over the course of pregnancy that is reversed following parturition.
(A) Timeline of mouse pregnancy study. Note that “days” here refers to experimental days, not embryonic ages. Blood was collected from C57Bl/6 mice before, during, and after pregnancy, and DNA isolated from this blood was subjected to DNAm clock analysis. (B–C) Blood clock DNAm age acceleration results from pregnant (B) and non-pregnant (C) mice. (D–E) Blood developmental clock DNAm age acceleration results from pregnant (D) and non-pregnant (E) mice. (F–H) Cross-sectional DNAm age acceleration analysis of pregnant Americans across the three trimesters of pregnancy using DNAmPhenoAge (F), DNAmGrimAge (G), and DunedinPoAm38 (H). (I–K) DNAm age biomarkers (as in f–h) for a longitudinal study of pregnant African Americans with two blood samples collected over the course of pregnancy. Time point 1 corresponds to 7–15 weeks of pregnancy; time point 2 corresponds to 24–32 weeks of pregnancy. (L–M) DNAmPhenoAge (L) and DNAmGrimAge (M) acceleration results from Swedish mothers longitudinally tracked over the course of pregnancy. Time point 1 corresponds to pre-pregnancy; time point 2 corresponds to 10–14 weeks of pregnancy; time point 3 corresponds to 26–28 weeks of pregnancy; time point 4 corresponds to 2–4 days postpartum. (N) DNAmPhenoAge (adjusted for the passage of time; see Methods for details) for a cohort of American mothers longitudinally tracked over the course of pregnancy and postpartum. Time point 1 corresponds to early pregnancy; time point 2 corresponds to mid-pregnancy; time point 3 corresponds to delivery; time point 4 corresponds to 6 weeks postpartum. P values were calculated using either repeated-measures ANOVA and paired t-tests or a mixed effects model with post-hoc pairwise comparison testing (see Methods). Sample sizes: B and D, n=8 animals total from which up to 4 samples were collected; C and E, n=5 animals total from which up to 4 samples were collected; F–H, n=9, 22, and 20 for trimesters 1, 2, and 3, respectively; I–K, n=53; L–M, n=33 total subjects who each provided up to 4 samples; N, n=14. Note that for the Born into Life Cohort, due to data sharing limitations, we were unable to obtain the CpG data necessary to analyze DunedinPACE. Note also that the White et al. 2012 dataset was generated using the Illumina HumanMethylation27 Beadchip, which limited our analysis to DNAm PhenoAge (panel N) and Horvath DNAm age (Figure S4D). See also Figure S4.
Figure 5.
Figure 5.. Patients with severe COVID-19 experience a reversible increase in DNAm age; treatment with tocilizumab enhances DNAm age recovery following ICU discharge.
(A–C) DNAm age acceleration results for DNAmPhenoAge (A), DNAmGrimAge (B), and DunedinPACE (C). All upper panels show data for female patients and all lower panels show data for male patients. Time point 1 is within 5 days of ICU admission; time point 2 is within 5 days of the midpoint of the ICU stay; time point 3 is within 5 days of the date of discharge from the ICU; timepoint 4 is ≥7 days post-ICU discharge. (D–F) DNAm age recovery, defined as the difference in DNAm age acceleration between time points 3 and 4), for patients treated with hydroxychloroquine (D), remdesivir (E), or tocilizumab (F). In A–C, p values were calculated using a mixed effects model with post-hoc pairwise comparison testing. In D–F, p values were calculated with unpaired t-tests. Sample sizes: A–C, n=10 female and n=19 male subjects total who each provided up to 4 samples; D, n=19 untreated and 10 treated patients; E, n=12 untreated and 17 treated patients; F, n=21 untreated and 8 treated patients. See also Figure S5.

References

    1. Zhang B, and Gladyshev VN (2020). How can aging be reversed? Exploring rejuvenation from a damage-based perspective. Adv. Genet. 1, e10025. 0.1002/ggn2.10025 - PMC - PubMed
    1. Horvath S, and Levine AJ (2015). HIV-1 Infection Accelerates Age According to the Epigenetic Clock. J. Infect. Dis. 212, 1563–1573. 10.1093/infdis/jiv277. - DOI - PMC - PubMed
    1. Wang T, Tsui B, Kreisberg JF, Robertson NA, Gross AM, Yu MK, Carter H, Brown-Borg HM, Adams PD, and Ideker T. (2017). Epigenetic aging signatures in mice livers are slowed by dwarfism, calorie restriction and rapamycin treatment. Genome Biol. 18, 57. 10.1186/s13059-017-1186-2. - DOI - PMC - PubMed
    1. Quach A, Levine ME, Tanaka T, Lu AT, Chen BH, Ferrucci L, Ritz B, Bandinelli S, Neuhouser ML, Beasley JM, et al. (2017). Epigenetic clock analysis of diet, exercise, education, and lifestyle factors. Aging 9, 419–437. 10.18632/aging.101168. - DOI - PMC - PubMed
    1. Nwanaji-Enwerem JC, Colicino E, Trevisi L, Kloog I, Just AC, Shen J, Brennan K, Dereix A, Hou L, Vokonas P, et al. (2016). Long-term ambient particle exposures and blood DNA methylation age: findings from the VA normative aging study. Environ. Epigenetics 2. 10.1093/eep/dvw006. - DOI - PMC - PubMed

Publication types