Mapping visual functions onto molecular cell types in the mouse superior colliculus
- PMID: 37086721
- PMCID: PMC10330256
- DOI: 10.1016/j.neuron.2023.03.036
Mapping visual functions onto molecular cell types in the mouse superior colliculus
Abstract
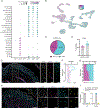
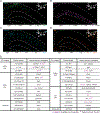
The superficial superior colliculus (sSC) carries out diverse roles in visual processing and behaviors, but how these functions are delegated among collicular neurons remains unclear. Here, using single-cell transcriptomics, we identified 28 neuron subtypes and subtype-enriched marker genes from tens of thousands of adult mouse sSC neurons. We then asked whether the sSC's molecular subtypes are tuned to different visual stimuli. Specifically, we imaged calcium dynamics in single sSC neurons in vivo during visual stimulation and then mapped marker gene transcripts onto the same neurons ex vivo. Our results identify a molecular subtype of inhibitory neuron accounting for ∼50% of the sSC's direction-selective cells, suggesting a genetic logic for the functional organization of the sSC. In addition, our studies provide a comprehensive molecular atlas of sSC neuron subtypes and a multimodal mapping method that will facilitate investigation of their respective functions, connectivity, and development.
Keywords: cell types; direction selectivity; inhibitory neurons; single-cell sequencing; superior colliculus; two-photon calcium imaging.
Copyright © 2023 The Authors. Published by Elsevier Inc. All rights reserved.
Conflict of interest statement
Declaration of interests The authors declare no competing interests.
Figures


Similar articles
-
Anatomical and electrophysiological analysis of cholinergic inputs from the parabigeminal nucleus to the superficial superior colliculus.J Neurophysiol. 2020 Dec 1;124(6):1968-1985. doi: 10.1152/jn.00148.2020. Epub 2020 Oct 21. J Neurophysiol. 2020. PMID: 33085555
-
Neurons in the most superficial lamina of the mouse superior colliculus are highly selective for stimulus direction.J Neurosci. 2015 May 20;35(20):7992-8003. doi: 10.1523/JNEUROSCI.0173-15.2015. J Neurosci. 2015. PMID: 25995482 Free PMC article.
-
Stimulus edges induce orientation tuning in superior colliculus.Nat Commun. 2023 Aug 8;14(1):4756. doi: 10.1038/s41467-023-40444-1. Nat Commun. 2023. PMID: 37553352 Free PMC article.
-
Visual Function, Organization, and Development of the Mouse Superior Colliculus.Annu Rev Vis Sci. 2018 Sep 15;4:239-262. doi: 10.1146/annurev-vision-091517-034142. Epub 2018 May 31. Annu Rev Vis Sci. 2018. PMID: 29852095 Review.
-
The superior colliculus and visual neglect in rat and hamster. I. Behavioural evidence.Brain Res. 1984 Dec;320(2-3):129-41. doi: 10.1016/0165-0173(84)90002-x. Brain Res. 1984. PMID: 6395934 Review.
Cited by
-
Accessing genetically defined cell types in the superior colliculus with transgenic mouse lines.iScience. 2025 Mar 11;28(4):112194. doi: 10.1016/j.isci.2025.112194. eCollection 2025 Apr 18. iScience. 2025. PMID: 40212591 Free PMC article.
-
Enhancement and contextual modulation of visuospatial processing by thalamocollicular projections from ventral lateral geniculate nucleus.Nat Commun. 2023 Nov 10;14(1):7278. doi: 10.1038/s41467-023-43147-9. Nat Commun. 2023. PMID: 37949869 Free PMC article.
-
Behavioral Modulation and Molecular Definition of Wide-Field Vertical Cells in the Mouse Superior Colliculus.J Neurosci. 2025 Apr 16;45(16):e1816242025. doi: 10.1523/JNEUROSCI.1816-24.2025. J Neurosci. 2025. PMID: 40032526 Free PMC article.
-
Transformation of Motion Pattern Selectivity from Retina to Superior Colliculus.J Neurosci. 2024 May 15;44(20):e1704232024. doi: 10.1523/JNEUROSCI.1704-23.2024. J Neurosci. 2024. PMID: 38569924 Free PMC article.
-
Characterize neuronal responses to natural movies in the mouse superior colliculus.Front Cell Neurosci. 2025 Mar 11;19:1558504. doi: 10.3389/fncel.2025.1558504. eCollection 2025. Front Cell Neurosci. 2025. PMID: 40134708 Free PMC article.
References
-
- May PJ (2006). The mammalian superior colliculus: laminar structure and connections. Prog Brain Res 151, 321–378. - PubMed
Publication types
MeSH terms
Substances
Grants and funding
LinkOut - more resources
Full Text Sources
Molecular Biology Databases

