. 2023 Apr 22;6(1):443.
doi: 10.1038/s42003-023-04784-4.

HaploCoV: unsupervised classification and rapid detection of novel emerging variants of SARS-CoV-2

Affiliations

HaploCoV: unsupervised classification and rapid detection of novel emerging variants of SARS-CoV-2

Matteo Chiara et al. Commun Biol. .

Abstract

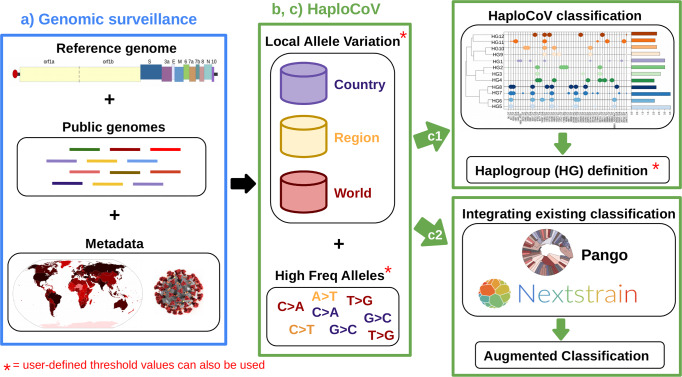
Accurate and timely monitoring of the evolution of SARS-CoV-2 is crucial for identifying and tracking potentially more transmissible/virulent viral variants, and implement mitigation strategies to limit their spread. Here we introduce HaploCoV, a novel software framework that enables the exploration of SARS-CoV-2 genomic diversity through space and time, to identify novel emerging viral variants and prioritize variants of potential epidemiological interest in a rapid and unsupervised manner. HaploCoV can integrate with any classification/nomenclature and incorporates an effective scoring system for the prioritization of SARS-CoV-2 variants. By performing retrospective analyses of more than 11.5 M genome sequences we show that HaploCoV demonstrates high levels of accuracy and reproducibility and identifies the large majority of epidemiologically relevant viral variants - as flagged by international health authorities - automatically and with rapid turn-around times.Our results highlight the importance of the application of strategies based on the systematic analysis and integration of regional data for rapid identification of novel, emerging variants of SARS-CoV-2. We believe that the approach outlined in this study will contribute to relevant advances to current and future genomic surveillance methods.


Conflict of interest statement

The authors declare no competing interests.

Figures

Fig. 1
Fig. 1. Principal component analysis of genomic variants frequencies in different geographic macro-areas.
Four distinct time intervals are considered, with time T0 set at Time 0 = December 26th 2019: the day of reported isolation of the first SARS-CoV-2 genomic sequence. a from day 0 to 199. b from day 200 to 399. c from day 400 to 599, d from day 600 to 850. The following acronym are used for different geographic areas AfrCent Central Africa, AfrEast Eastern Africa, AfrN Northern Africa, AfrSouth Southern Africa, AfrW Western Africa, AsiaCent Central Asia, AsiaEast Eastern Asia, AsiaME Middle East, AsiaSE South Eastern Asia, AsiaSO Southern Asia, Euc Central Europe, EuEa Eastern Europe, EuNo Northern Europe, EuSo Southern Europe, EuUK United Kingdom, NAcent central America, NAnorth North America, Oc Oceania, SAM South America. See Supplementary Data 3 for the correspondence between geographic areas and countries.
Fig. 2
Fig. 2. Workflow and potential applications of HaploCoV.
a SARS-CoV-2 genomic surveillance: genome sequences and associated metadata, obtained from publicly available repositories and/or other resources, are consolidated into a local database. b HaploCoV workflow: Firstly, genomic sequences are compared with the reference genome assembly of SARS-CoV-2 to derive a complete collection of genomic variants. Subsequently allele frequencies are computed and a collection of high frequency genomic variants is obtained. Finally, phenetic clustering of high frequency genomic variants is applied: to (c1) derive HGs of SARS-CoV-2 based on a user defined minimum phenetic distance (i.e., groups that differ by more than a user defined number of genomic variants); and/or (c2) to complement an existing classification system by applying phenetic clustering to pre-defined groups/lineages. The illustration of the SARS-CoV-2 structure included in the figure was obtained from the Public Health Image Library (PHIL) by the Centers for Disease Control and Prevention (CDC), at https://phil.cdc.gov/Details.aspx?pid=23312.
Fig. 3
Fig. 3. Stability and reproducibility metrics.
Phen. Dist. Closest HG pairs: phenetic distance between closest pairs of HGs formed at distinct bootstrap iterations. This metric measures the similarity between matched HGs formed at different iterations. A value of 0 indicates completely identical HGs (defined by an identical set of genomic variants). Tot. num. HG assignment per genome: distribution of the total number of distinct HGs to which a genomic sequence was assigned at distinct bootstrap iterations. A value of 1 indicates perfect reproducibility (i.e., the genome was consistently assigned to the same HGs at every iteration). HG size CV: coefficient of variation (CV) of the size (total number of genomes assigned) to matched HGs formed at distinct bootstrap iterations. A value of 0 indicates no variability in the size of matched HGs (i.e., the same number of genomes is assigned to matched HGs at distinct iterations). Distributions are represented in the form of a violin plot. In the boxplots, white dots denote median values; boxes extend from the 25th to the 75th percentile; vertical extending lines denote adjacent values (i.e., the most extreme values within 1.5 interquartile range of the 25th and 75th percentile of each group). The source data behind this figure is reported in Supplementary Data 19.
Fig. 4
Fig. 4. PCA representation of 113 descriptive features for the 2607 Pango/Pango+ lineages and the 1571 HGs.
Distinct colors are used to represent VOC (red), VOI (yellow), VUM (green) and other variants (blue). a Pango/Pango+ Lineages, PC1 and PC2. Pango+ lineages are. b HGs, PC1 and PC2. c Pango/Pango+ Lineages, PC1 and PC3. d HGs, PC1 and PC3. Pango+ lineages are marked by an overlaid black dot. The 113 descriptive features are listed in Supplementary Data 12.
Fig. 5
Fig. 5. Distribution of the intra-group genetic distance and sites under selection in VOCs/VOIs/VUMs compared to other variants.
a Distribution of genetic distance, computed as the total number of distinct polymorphic sites between closest pairs of genomes assigned to Pango/Pango+ lineages and HGs, separately for VOC/VOI/VUM and for non VOC/VOI/VUM variants (indicated as others). Distances are indicated on the Y-axis. b Proportion of non-defining genomic variants predicted to be under selection (according to Hyphy) in Pango/Pango+ lineages and HGs separately for VOCs/VOIs/VUMs and for all remaining variants (indicated as others). Ratios are indicated on the Y-axis. Distributions are represented in the form of a violin plot. In the boxplots, white dots denote median values; boxes extend from the 25th to the 75th percentile; vertical extending lines denote adjacent values (i.e., the most extreme values within 1.5 interquartile range of the 25th and 75th percentile of each group). The source data behind this figure is reported in Supplementary Data 20.
Fig. 6
Fig. 6. Interesting Pango+ lineages derivative of Delta VOC.
a Defining genomic variants and prevalence of the B.1.617.2.N13 Pango+ lineage. Red: novel genomic variants specific to the Pango+ lineage; black: genomic variants characteristic of Delta in the Spike glycoprotein (S); gray: genomic variants characteristic of Delta outside the S gene. Barplots represent the total number of sequences and estimated prevalence of B.1.617.2.N13 in countries from which more than 50 genome sequences were recovered (log10 scale) and total number of genome sequences assigned to B.1.617.2.N13 from April 2021 to August 2021. b Defining genomic variants and prevalence of B.1.617.2.N11 Pango+ lineage. Red: novel genomic variants specific to the Pango+ lineage; black: genomic variants characteristic of Delta in the Spike glycoprotein (S); gray: genomic variants characteristic of Delta outside the S gene. Barplots represent the total number of sequences and estimated prevalence of B.1.617.2.N13 in countries from which more than 50 genome sequences were recovered (log10 scale) and total number of genome sequences assigned to B.1.617.2.N13 from May 2021 to November 2021. Annotation of protein-coding genes and protein domain according to the Uniprot annotation (UP000464024) of the reference SARS-CoV-2 genome (NC_045512). The source data behind this figure is reported in Supplementary Data 21.

Similar articles

Cited by

References

    1. Lo SW, Jamrozy D. Genomics and epidemiological surveillance. Nat. Rev. Microbiol. 2020;18:478. doi: 10.1038/s41579-020-0421-0. - DOI - PMC - PubMed
    1. Shu Y, McCauley J. GISAID: Global initiative on sharing all influenza data - from vision to reality. Eur. Surveill. 2017;22:30494. doi: 10.2807/1560-7917.ES.2017.22.13.30494. - DOI - PMC - PubMed
    1. Rambaut A, et al. A dynamic nomenclature proposal for SARS-CoV-2 lineages to assist genomic epidemiology. Nat. Microbiol. 2020;5:1403–1407. doi: 10.1038/s41564-020-0770-5. - DOI - PMC - PubMed
    1. World Health Organization. Tracking SARS-CoV-2 variants. https://www.who.int/en/activities/tracking-SARS-CoV-2-variants/ (2022). - PubMed
    1. Wall EC, et al. Neutralising antibody activity against SARS-CoV-2 VOCs B.1.617.2 and B.1.351 by BNT162b2 vaccination. Lancet. 2021;397:2331–2333. doi: 10.1016/S0140-6736(21)01290-3. - DOI - PMC - PubMed

Publication types

Supplementary concepts