. 2023 Apr 22;11(1):66.
doi: 10.1186/s40478-023-01559-0.

Long term worsening of amyloid pathology, cerebral function, and cognition after a single inoculation of beta-amyloid seeds with Osaka mutation

Affiliations

Long term worsening of amyloid pathology, cerebral function, and cognition after a single inoculation of beta-amyloid seeds with Osaka mutation

Marina Célestine et al. Acta Neuropathol Commun. .

Abstract

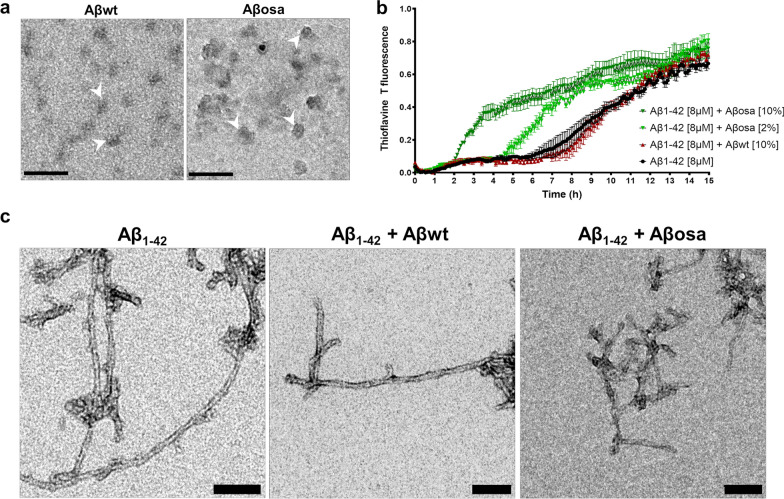
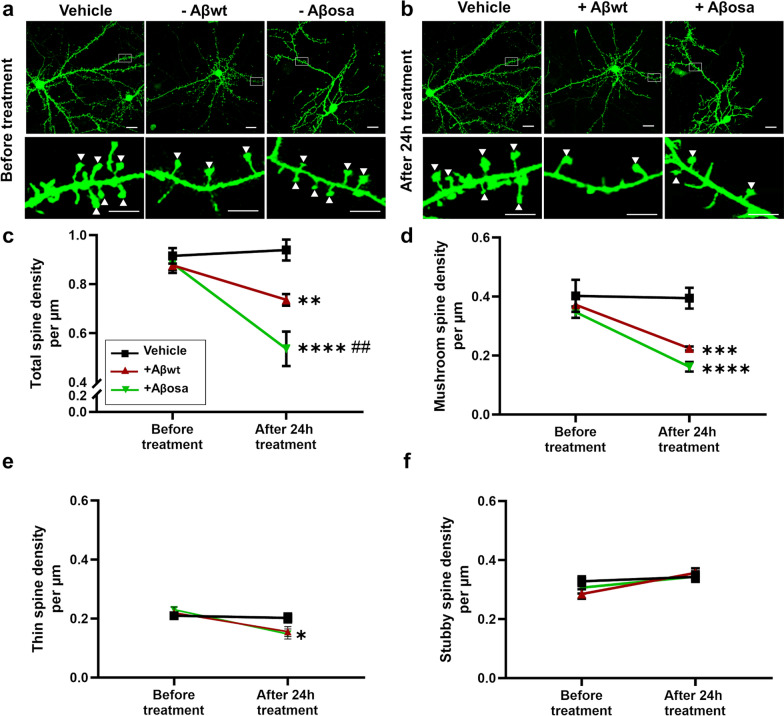
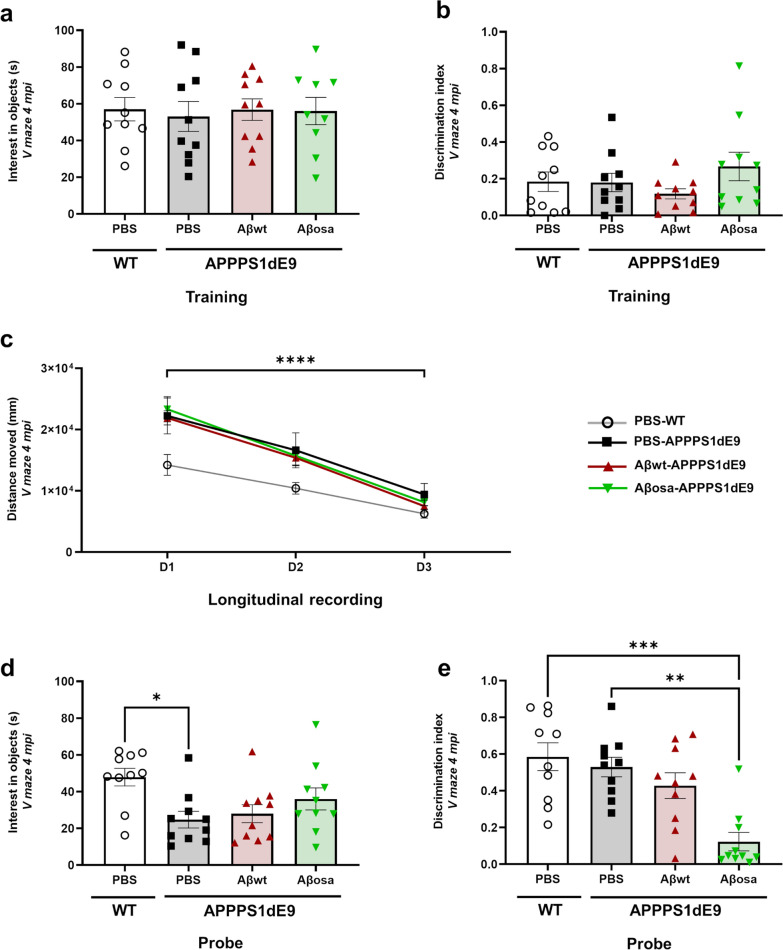
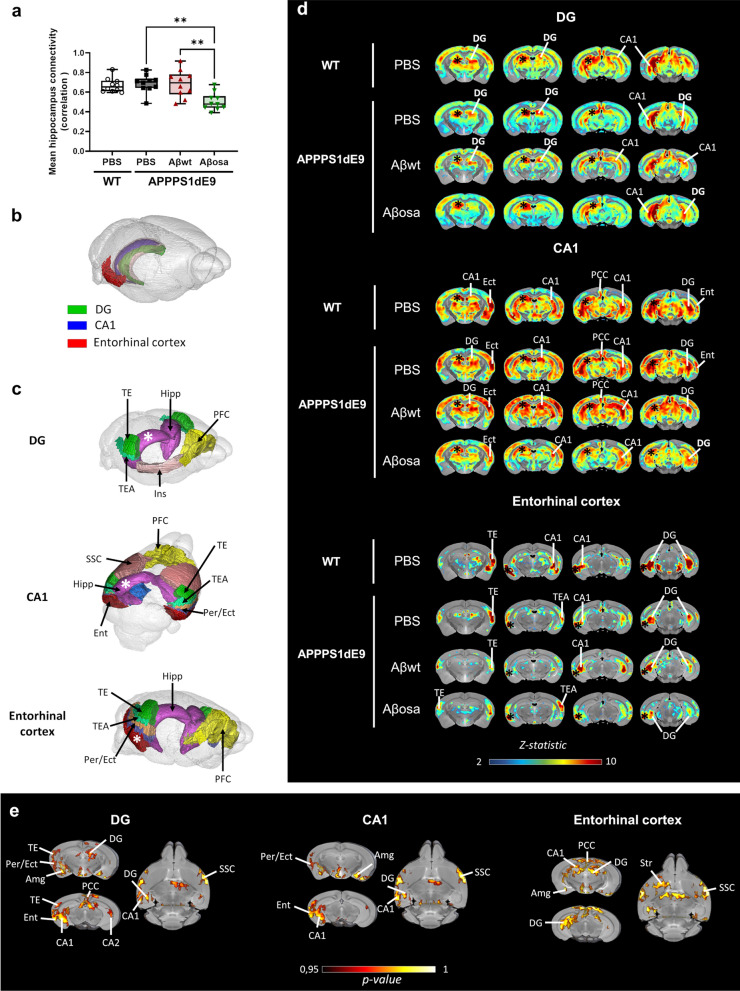
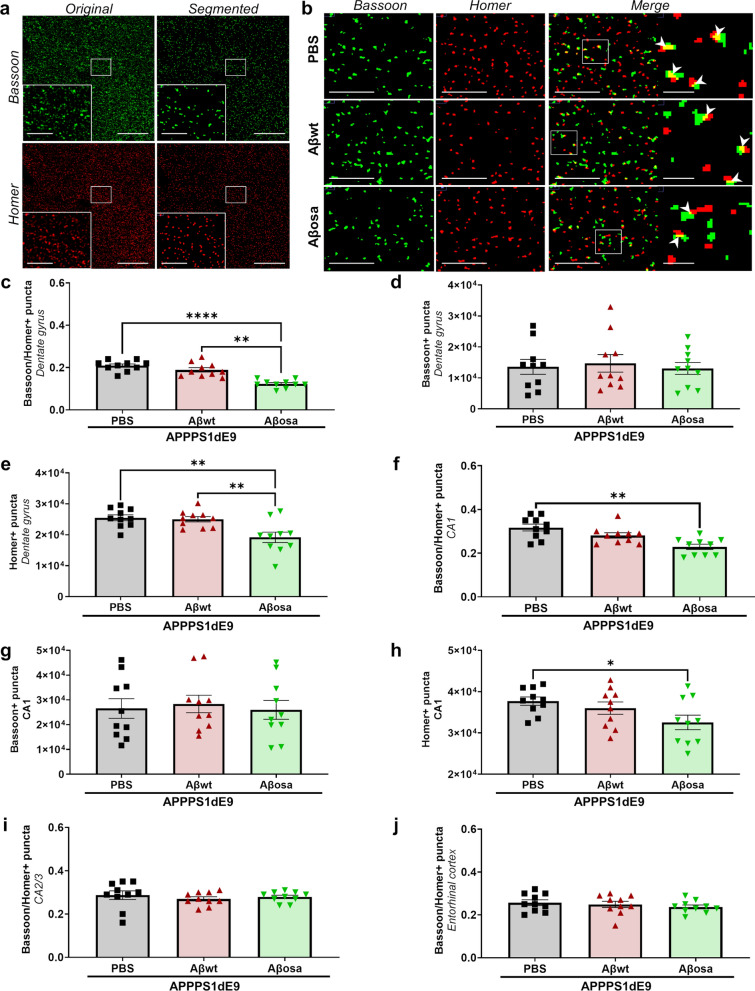
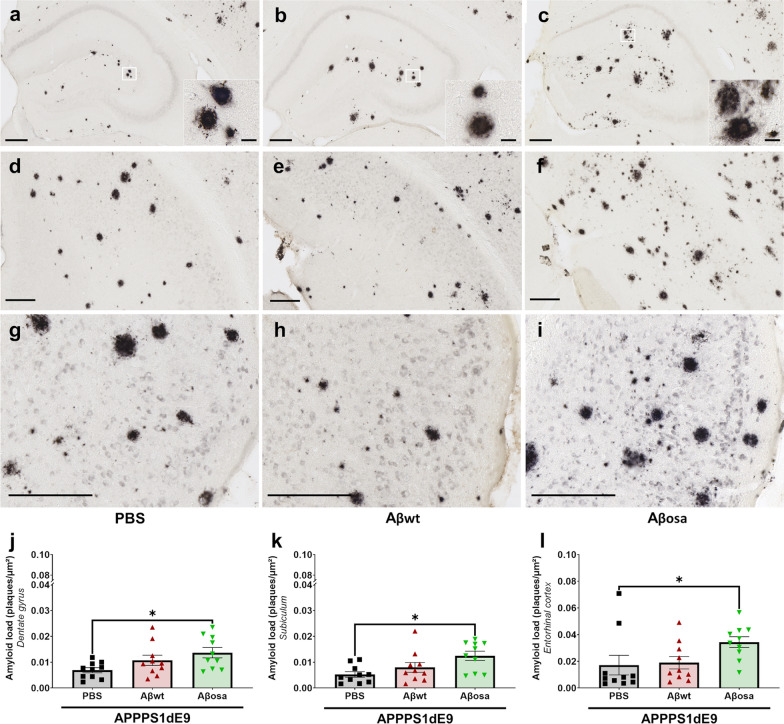
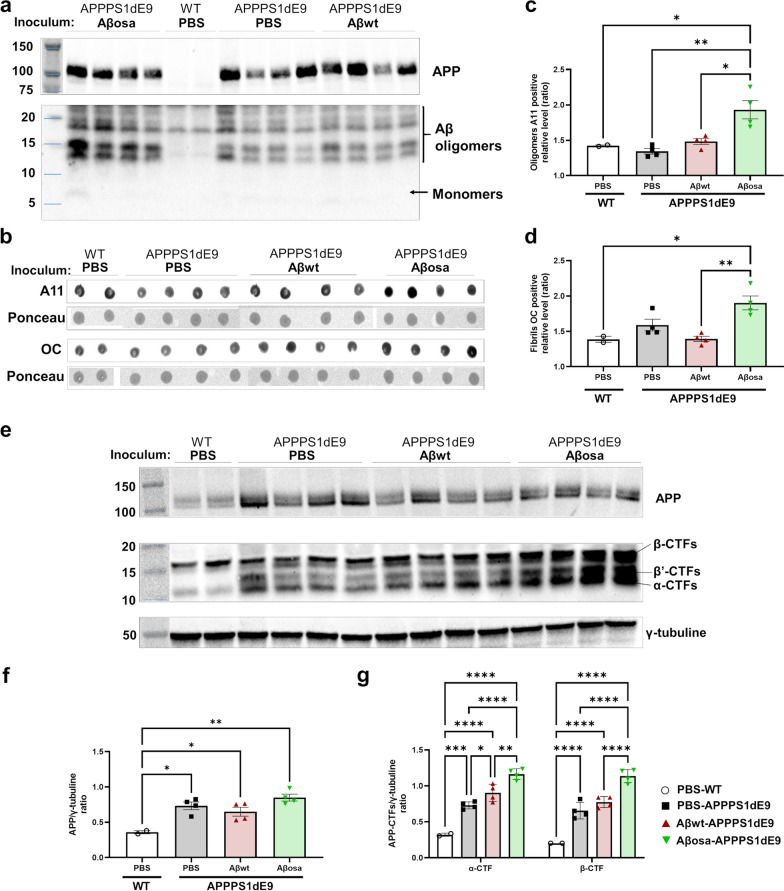
Alzheimer's disease (AD) is characterized by intracerebral deposition of abnormal proteinaceous assemblies made of amyloid-β (Aß) peptides or tau proteins. These peptides and proteins induce synaptic dysfunctions that are strongly correlated with cognitive decline. Intracerebral infusion of well-defined Aβ seeds from non-mutated Aβ1-40 or Aβ1-42 peptides can increase Aβ depositions several months after the infusion. Familial forms of AD are associated with mutations in the amyloid precursor protein (APP) that induce the production of Aβ peptides with different structures. The Aβ Osaka (Aβosa mutation (E693Δ)) is located within the Aβ sequence and thus the Aβosa peptides have different structures and properties as compared to non-mutated Aβ1-42 peptides (Aβwt). Here, we wondered if a single exposure to this mutated Aβ can worsen AD pathology as well as downstream events including cognition, cerebral connectivity and synaptic health several months after the inoculation. To answer this question we inoculated Aβ1-42-bearing Osaka mutation (Aβosa) in the dentate gyrus of APPswe/PS1dE9 mice at the age of two months. Their cognition and cerebral connectivity were analyzed at 4 months post-inoculation by behavioral evaluation and functional MRI. Aβ pathology as well as synaptic density were evaluated by histology. The impact of Aβosa peptides on synaptic health was also measured on primary cortical neurons. Remarkably, the intracerebral administration of Aβosa induced cognitive and synaptic impairments as well as a reduction of functional connectivity between different brain regions, 4 months post-inoculation. It increased Aβ plaque depositions and increased Aβ oligomers. This is the first study showing that a single, sporadic event as Aβosa inoculation can worsen the fate of the pathology and clinical outcome several months after the event. It suggests that a single inoculation of Aβ regulates a large cascade of events for a long time.

Keywords: Alzheimer’s disease; Amyloid-β; Aβ Osaka; Cerebral connectivity; Memory; Synapses.


Conflict of interest statement

The authors declare that they have no competing interests.

Figures

Fig. 1
Fig. 1
Properties of wt and mutated Aβ assemblies. a. Representative electron microscopy images of small and large particles in Aβwt and Aβosa solution. Scale bars: 100 nm. b. Kinetics of synthetic Aβ1-42 aggregation monitored by thioflavin T fluorescence in the absence and presence of Aβwt and Aβosa seeds. Aggregation experiments were performed in triplicates. Aβ1-42 monomer concentration is 8 μM, in a PBS buffer at 37 °C with continuous agitation. The aggregation curves were normalized to maximal values of ThT fluorescence at plateau. Symbols and error bars are the average and standard deviation, respectively, of three independent kinetics experiments. c. Representative electron microscopy images Aβ fibrils following the aggregation experiments. Scale bars: 100 nm
Fig. 2
Fig. 2
Exposure to exogenous Aβosa and Aβwt differentially impaired synapses. a-b. Representative images of primary cultures of cortical neurons expressing LA-GFP before (a), and after treatment for 24 h with 100 nM of Aβosa or Aβwt (b). Top row wide field view, scale bar = 10 µm; bottom row: dendrite portions with mushroom spines (white arrows, scale bar = 5 µm). c. Quantification of total spine density showed a reduction of total number of spines after treatment with Aβosa and Aβwt, compared to PBS (34.7 ± 3.1% for Aβosa, p < 0.0001; 14.1 ± 3.4% for Aβwt, p = 0.0049). The spine loss was significantly more severe in Aβosa compared to Aβwt (p = 0.0048). d. Quantification of mushroom spine density showed a reduction of the number of mushroom spines after treatment with Aβwt and Aβosa (respectively p = 0.0005 and p < 0.0001). e. Quantification of thin spine density showed a reduction of the number of mushroom spines after treatment with Aβosa (p < 0.1). f. Stubby spine density was not modified after treatment with the different Aβ seeds. n = 6 neurons from at least 3 different cultures. Data are shown as mean ± s.e.m. Kruskal–Wallis with Dunn’s multiple comparisons. *p < 0.5, ** or ## p < 0.05, ***p < 0.005, ****p < 0.0005
Fig. 3
Fig. 3
Memory impairment of APPswe/PS1de9 mice following Aβ inoculation. Novel object recognition was evaluated in a V-maze at 4 months post-inoculation. a. The time spent on exploring the two identical objects (in seconds) during the training phase is similar between group (p = 0.94). b. Mice performance during the training phase. Similar discrimination indexes were found for all groups when mice had to discriminate two identical objects (p > 0.05, Kruskal–Wallis with Dunn’s multiple comparisons). c. Distance moved throughout 3 days of tests (exploration, training and probe-test days). Measurements revealed a time-effect from day 1 to day 3 (F(1.49, 53.95) = 123.8, p < 0.0005), but no differences between experimental groups (p > 0.05) (two-way repeated measures ANOVA with the Geisser-Greenhouse correction and Dunnett’s multiple comparisons). d. Novel object recognition evaluated by the time spent on exploring the objects (in seconds) highlighted group effects (p = 0.02). Post-hoc analysis showed that the PBS-inoculated wild-type mice group had a higher exploratory activity than PBS-inoculated APPswe/PS1dE9 (p = 0.02) while all groups of APPswe/PS1de9 mice had comparable exploratory activity (Kruskal–Wallis with Dunn’s multiple comparisons). e. Object discrimination index. APPswe/PS1de9 mice inoculated with Aβosa spent less time exploring the novel object compared to PBS-inoculated WT mice or APPswe/PS1dE9 mice (group analysis using Kruskal–Wallis (p = 0.0006) with post-hoc analysis using Dunn’s multiple comparisons p = 0.0008 and p = 0.0046, for Aβosa versus PBS-inoculated WT and APPswe/PS1dE9 mice, respectively). nWT-PBS = 10, nAPP/PS1-PBS = 10, nAβwt = 10, nAβosa = 10 mice. Data are shown as mean ± s.e.m
Fig. 4
Fig. 4
osa inoculated animals displayed abnormal brain connectivity within hippocampal-memory circuits. a. Mean hippocampus connectivity changes measured by resting-state functional MRI. Aβosa-inoculated group displayed a decreased hippocampus connectivity compared to PBS and Aβwt-inoculated mice at 4mpi (Kruskal–Wallis with Dunn’s multiple comparisons. group effect p = 0.002; p = 0.006 and p = 0.01 for Aβosa-inoculated group versus PBS or Aβwt-inoculated mice). b. 3D representation of the three brain regions -DG, CA1 and the entorhinal cortex- used for the seed-based analyses (SBA). c. SBA-derived resting state networks found in PBS-inoculated APPswe/PS1dE9 are shown for each seed (the white asterisk represents the location of the seeds where the signal was extracted). d. Correlation maps of each seed. The color scale bar represents the strength of the functional correlation normalized with a fisher z-transformation. Black asterisks represent the location of the seeds. Differences are found between groups in inter-hemispheric homotopic FC. e. Voxelwise nonparametric permutation tests of FC correlation maps. Aβosa-inoculated mice have a lower FC in the hippocampus compared to PBS-inoculated mice (p < 0.001). The color scale bar represents the statistical significant p-value. DG = dentate gyrus, Hipp = hippocampus, TE = temporal area, TEA = temporal associative area, Per/Ect = perirhinal + ectorhinal cortex, Ins = Insular, Amg = amygdalar area, Ent = entorhinal cortex, PCC = posterior cingulate cortex, SSC = primary somatosensory area, Str = striatum. nWT-PBS = 10, nAPP/PS1-PBS = 10, nAβwt = 10, nAβosa = 10 mice
Fig. 5
Fig. 5
osa exacerbates long-term synaptotoxicity in vivo. a. Representative views of original Bassoon/Homer images and segmented puncta in APPswe/PS1dE9 mice. Scale bars main images: 20 µm; Insets: 5 µm. b. Co-localisation puncta of Bassoon/Homer labels (white arrow). Scale bars main images: 5 µm; Insets: 1 µm. c-h. Quantification of synaptic density from Bassoon/Homer colocalization (c, f), Bassoon (d, g) and Homer (e, h) in the dentate gyrus and and CA1 showed decrease of synaptic density and post-synaptic density (Homer) in the dentate gyrus and CA1 of Aβosa-inoculated APPswe/PS1dE9 mice (c: Bassoon/Homer in dentate gyrus—overall effect: p < 0.0001 (Kruskal–Wallis). Post-hoc evaluation with Dunn’s multiple comparisons: Aβosa- versus PBS-inoculated APPswe/PS1dE9: p < 0.0001; Aβwt- versus Aβosa-inoculated APPswe/PS1dE9: p = 0.003; e: Homer in dentate gyrus—overall effect: p = 0.0015 (Kruskal–Wallis). Post-hoc evaluation with Dunn’s multiple comparisons: Aβosa- versus PBS-inoculated APPswe/PS1dE9: p = 0.0029; Aβwt- versus Aβosa-inoculated APPswe/PS1dE9: p = 0.0058; f: Bassoon/Homer in CA1—overall effect: p = 0.002 (Kruskal–Wallis). Post-hoc evaluation with Dunn’s multiple comparisons: Aβosa- versus PBS-inoculated animals: p = 0.002; h: Homer in CA1—overall effect: p = 0.0535 (Kruskal–Wallis). Post-hoc evaluation with Dunn’s multiple comparisons: Aβosa- versus PBS-inoculated APPswe/PS1dE9: p = 0.0469. There were no changes in the different groups in the CA2/3 (i) and in the entorhinal cortex (j). nAPP/PS1-PBS = 10, nAβwt = 10, nAβosa = 10 mice. For each image, quantification was made on 26 sections separated by 0.2 µm step. A surface of 81.92*81.92µm2 was measured for each section. Data are shown as mean ± s.e.m
Fig. 6
Fig. 6
Modulation of Aβ plaque load following inoculation of Aβ variants. Representative images of 4G8 immunolabeling showing Aβ plaque deposition in the dorsal hippocampus (a-c), subiculum (d-f) and entorhinal cortex (g-i) of APPswe/PS1dE9 mice after PBS, Aβwt or Aβosa inoculation in the dentate gyrus. j-l. Quantification of amyloid load (4G8-positive amyloid plaques per µm2) in the dentate gyrus (j), in the subiculum (k), and in the entorhinal cortex (l). Aβosa increases Aβ plaque deposition in the dentate gyrus (p = 0.04), in the subiculum (p = 0.02), in the entorhinal cortex (p = 0.02). Kruskal–Wallis with Dunn’s multiple comparisons. nAPP/PS1-PBS = 10, nAβwt = 10, nAβosa = 10 mice. Data are shown as mean ± s.e.m. Scale bars main images: 200 µm; Insets: 20 µm
Fig. 7
Fig. 7
APP proteolysis profiles and oligomerization of amyloid-β peptides at 4 mpi. a. Western-blot analysis (6E10 Antibody) of total human APP and Aβ oligomeric species in sarkosyl-soluble extracts of the hippocampus of APPswe/PS1dE9 mice after PBS, Aβwt or Aβosa inoculation at 4mpi. Full length APP runs at an apparent molecular size of 110 kDa, oligomeric forms of Aβ are detected at 15 kDa and 12 kDa. b. Dot blot analysis for oligomeric species (A11) and fibrils (OC) in sarkosyl-soluble extract from the hippocampus. c. Quantification of relative expression levels of A11 are presented. Aβosa increased oligomer forms compared to PBS- (p = 0.0019), Aβwt-inoculated (p = 0.0106) APPswe/PS1dE9 and WT mice (p = 0.0142). d. Quantification of relative expression levels of OC are presented. Aβosa increased fibrils compared to Aβwt-inoculated (p = 0.0038) APPswe/PS1dE9 and WT mice (p = 0.0118) e. Western-blot analysis (APP-Cter-17 antibody) of total endogenous APP, APP-CTFs and tubulin in hippocampus lysates (S100K fractions) obtained from wild-type and APPswe/PS1dE9 mice after PBS, Aβwt or Aβosa inoculation. Tubulin staining was used as a marker and loading control. f-g. Semi-quantification of APP (APP-Cter-C17 Antibody (f)) and of β-CTF/C99 and α-CTF/C83 (APP-Cter-C17 Antibody (g)) [39]. Kruskal–Wallis with Dunn’s multiple comparisons. *p < 0.5, **p < 0.05, ***p < 0.005, ****p < 0.0005. nWTPBS = 2, nAPP/PS1PBS = 4, nAβwt = 4, nAβosa = 4 mice. Data are shown as mean ± s.e.m

Similar articles

Cited by

References

    1. Abraham A, Pedregosa F, Eickenberg M, Gervais P, Mueller A, Kossaifi J, Gramfort A, Thirion B, Varoquaux G. Machine learning for neuroimaging with scikit-learn. Front Neuroinform. 2014 doi: 10.3389/fninf.2014.00014. - DOI - PMC - PubMed
    1. Balducci C, Beeg M, Stravalaci M, Bastone A, Sclip A, Biasini E, Tapella L, Colombo L, Manzoni C, Borsello T, Chiesa R, Gobbi M, Salmona M, Forloni G. Synthetic amyloid-beta oligomers impair long-term memory independently of cellular prion protein. Proc Natl Acad Sci USA. 2010;107:2295–2300. doi: 10.1073/pnas.0911829107. - DOI - PMC - PubMed
    1. Celestine M, Nadkarni NA, Garin C, Bougacha S, Dhenain M. Sammba-MRI, a library for small animal neuroimaging data processing in Python. Front Neuroinform. 2020 doi: 10.3389/fninf.2020.00024. - DOI - PMC - PubMed
    1. Dorr AE, Lerch JP, Spring S, Kabani N, Henkelman RM. High resolution three-dimensional brain atlas using an average magnetic resonance image of 40 adult C57Bl/6J mice. Neuroimage. 2008;42:60–69. doi: 10.1016/j.neuroimage.2008.03.037. - DOI - PubMed
    1. du Sert NP, Hurst V, Ahluwalia A, Alam S, Avey MT, Baker M, Browne WJ, Clark A, Cuthill IC, Dirnagl U, Emerson M, Garner P, Holgate ST, Howells DW, Karp NA, Lazic SE, Lidster K, MacCallum CJ, Macleod M, Pearl EJ, Petersen OH, Rawle F, Reynolds P, Rooney K, Sena ES, Silberberg SD, Steckler T, Wurbel H. The ARRIVE guidelines 20: Updated guidelines for reporting animal research. Bmc Veterinary Research. 2020 doi: 10.1186/s12917-020-02451-y. - DOI - PMC - PubMed

Publication types

Substances