. 2023 Apr 22;14(1):2329.
doi: 10.1038/s41467-023-37470-4.

Rhinovirus-induced epithelial RIG-I inflammasome suppresses antiviral immunity and promotes inflammation in asthma and COVID-19

Affiliations

Rhinovirus-induced epithelial RIG-I inflammasome suppresses antiviral immunity and promotes inflammation in asthma and COVID-19

Urszula Radzikowska et al. Nat Commun. .

Erratum in

Abstract

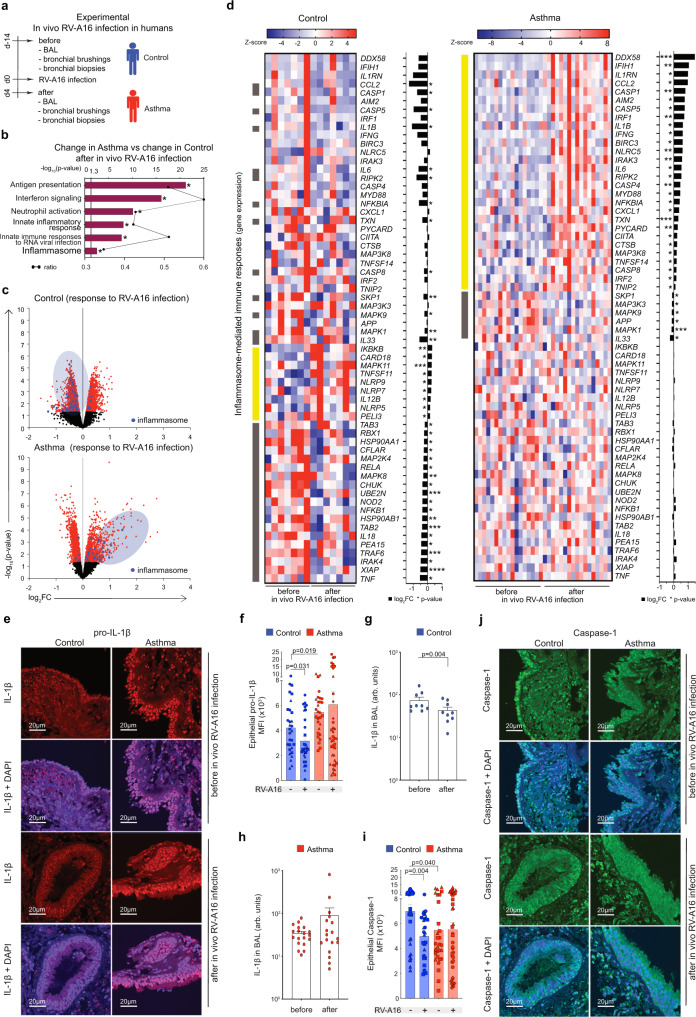
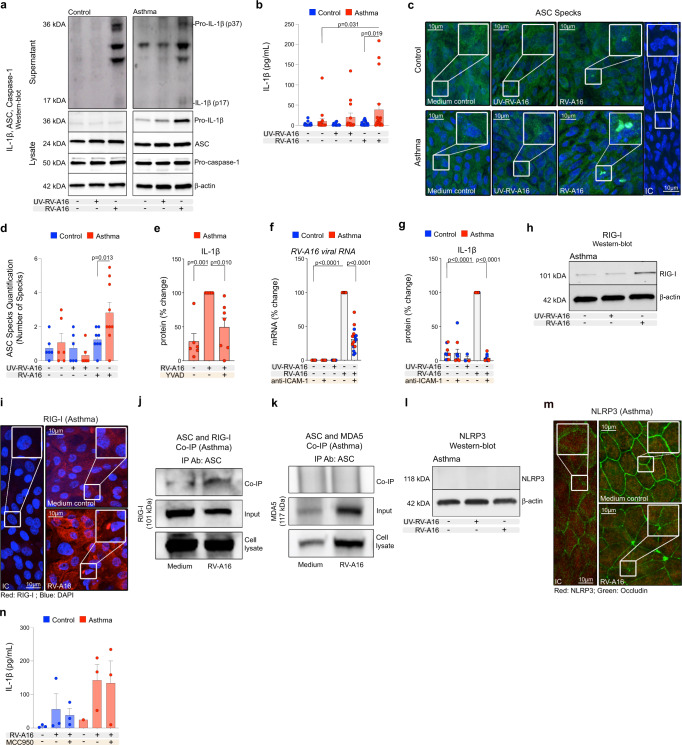
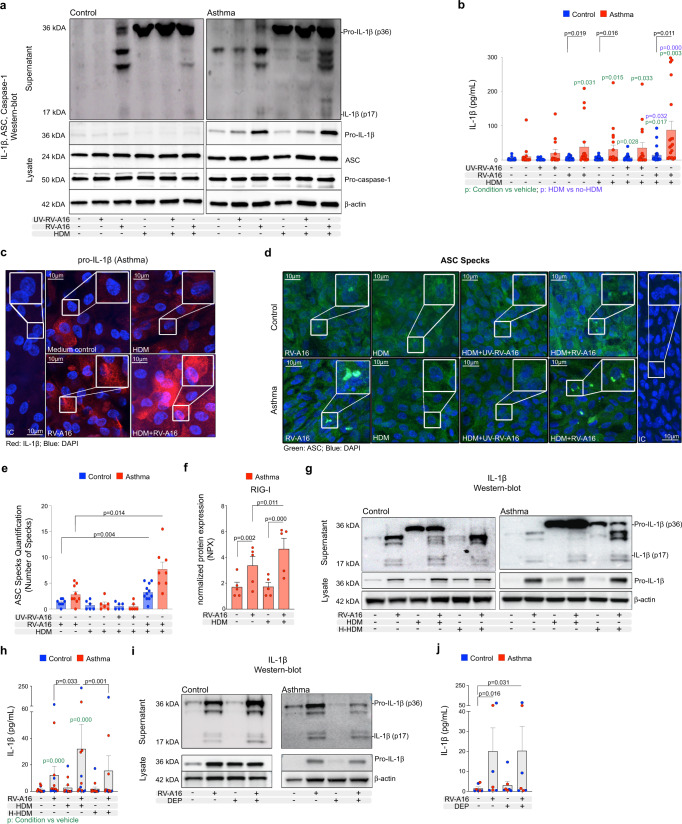
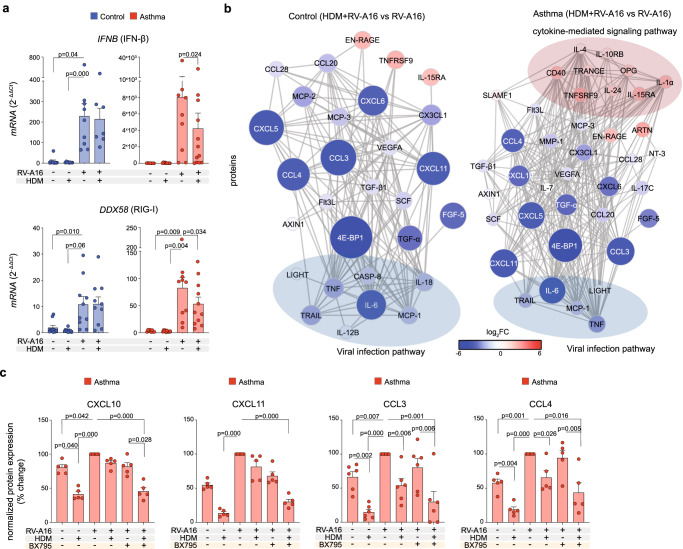
Rhinoviruses and allergens, such as house dust mite are major agents responsible for asthma exacerbations. The influence of pre-existing airway inflammation on the infection with severe acute respiratory syndrome coronavirus 2 (SARS-CoV-2) is largely unknown. We analyse mechanisms of response to viral infection in experimental in vivo rhinovirus infection in healthy controls and patients with asthma, and in in vitro experiments with house dust mite, rhinovirus and SARS-CoV-2 in human primary airway epithelium. Here, we show that rhinovirus infection in patients with asthma leads to an excessive RIG-I inflammasome activation, which diminishes its accessibility for type I/III interferon responses, leading to their early functional impairment, delayed resolution, prolonged viral clearance and unresolved inflammation in vitro and in vivo. Pre-exposure to house dust mite augments this phenomenon by inflammasome priming and auxiliary inhibition of early type I/III interferon responses. Prior infection with rhinovirus followed by SARS-CoV-2 infection augments RIG-I inflammasome activation and epithelial inflammation. Timely inhibition of the epithelial RIG-I inflammasome may lead to more efficient viral clearance and lower the burden of rhinovirus and SARS-CoV-2 infections.


Conflict of interest statement

CA reports research grants from Allergopharma, Idorsia, Swiss National Science Foundation, Christine Kühne-Center for Allergy Research and Education, European Commission’s Horison’s 2020 Framework Programme “Cure”, Novartis Research Institutes, Astrazeneca, SciBase, Stanford University SEAN Parker Asthma and Allergy Center; advisory board of Sanofi/Regeneron, GSK and Novartis, consulting fees from Novartis; Editor-in-Chief Allergy, Co-Chair EAACI Environmental Science in Allergic Diseases and Asthma Guidelines. AE reports National Science Centre Grant No. 2020/37/N/NZ5/04144, National Centre for Research and Development No. STRATEGMED2/269807/14/NCBR/2015, National Centre for Research and Development (POLTUR3/MT-REMOD/2/2019). DJJ reports advisory board and speaker fees from AstraZeneca, GSK and Sanofi and research grants from AstraZeneca. SLJ reports grants/contracts from European Research Council ERC FP7 grant number 233015, Chair from Asthma UK CH11SJ, Medical Research Council Centre grant number G1000758, NIHR Biomedical Research Centre grant number P26095, Predicta FP7 Collaborative Project grant number 260895, NIHR Emeritus NIHR Senior Investigator; consulting fees from Lallemand Pharma, Bioforce, resTORbio, Gerson Lehrman Group, Boehringer Ingelheim, Novartis, Bayer, Myelo Therapeutics GmbH; patents issued/licensed: Wark PA, Johnston SL, Holgate ST, Davies DE. Anti-virus therapy for respiratory diseases. UK patent application No. GB 0405634.7, 12March 2004. Wark PA, Johnston SL, Holgate ST, Davies DE. Interferon-Beta for Anti-Virus Therapy for Respiratory Diseases. International Patent Application No. PCT/GB05/50031, 12 March 2004. Davies DE, Wark PA, Holgate ST, JohnstonSL. Interferon Lambda therapy for the treatment of respiratory disease. UK patent application No. 6779645.9, granted15th August 2012; Participation on a data safety monitory board or advisory board: Enanta Chair of DSMB, Virtus Respiratory Research Board membership. MJ reports RID- European Commission Research Grant, personal fees from Allergopharma, Stallergenes, Regeneron, Pfizer, Chiesi, Allergopharma, Stallergenes Greer, HAL Allergy; membership in safety monitoring board in Allergopharma; EAACI President position; Clinical Investigator Honoraria from GSK, AstraZeneca, Regeneron, Genetech, Takeda, Chiesi, Novartis, Allergopharma, Stallergenes, Allergy Therapeutics, HAL Allergy, ALK Abello, Shire, Celltrion, Verona Pharma. MM reports personal payments from Astra Zeneca, GSK, Berlin-Chemie/Menarini, Lek-AM, Takeda, Celon and support for attending meetings from Astra Zeneca, GSK, Berlin-Biochemie/Menarini. UR reports board secretary position of Working Group of Genomics and Proteomics of the European Academy of Allergy and Clinical Immunology (EAACI). JRC reports Pre-doctoral grant FPI from Universidad CEU San Pablo, Swiss European Mobility Program grant from University of Zurich, EAACI Mid-term Fellowship. M.So reports research grants from Swiss National Science Foundation (nr 310030_189334/1), Novartis Foundation for Medical-Biological Research, GSK, and Stiftung vorm. Buendner Heilstaette Arosa; speaker’s fee from AstraZeneca; voluntary positions in the European Academy of Allergy and Clinical Immunology (EAACI) as Executive Board member and Basic and Clinical Immunology Section Chair. SS reports funding from National Center of Competence in Research (NCCR) on RNA and Disease to VT (https://nccr-rna-and-disease.ch/). VT reports grant from Swiss National Science Foundation (nr 31CA30_196644). All other authors declare no competing interest.

Figures

Fig. 1
Fig. 1. Intranasal infection with rhinovirus induced inflammasome-mediated immune responses in the epithelium of lower airways in asthma.
a Overview of the experimental in vivo RV-A16 infection in humans. b Top significantly enriched pathways within genes changed after in vivo RV-A16 infection in bronchial brushings from patients with asthma compared to genes changed in control individuals (control n = 7, asthma n = 17). Black line represents a ratio of genes in the experiment over the whole pathway set. c Volcano plots of all (black), significant (red), and significant inflammasome-mediated immune response (blue) genes in bronchial brushings from controls (upper panel) and patients with asthma (lower panel) after in vivo RV-A16 infection (control n = 7, asthma n = 17). d Heatmap of genes encoding inflammasome-mediated immune responses after in vivo RV-A16 infection in controls (left panel) and patients with asthma (right panel) presented together with the corresponding log2 fold change (FC) expression changes (black bars) (control n = 7, asthma n = 17). Yellow and grey left-side color bars represent genes upregulated and downregulated, respectively. e–f Representative confocal images of pro-IL-1β in bronchial biopsies at baseline and after in vivo RV-A16 infection, scale bars: 20 μm. Quantification based on the MFI x103: 10 equal epithelial areas from each biopsy (demonstrated as circles, squares, triangles, or diamonds) of control subjects (n = 3, before; n = 3, after) and patients with asthma (n = 3, before; n = 4, after). g–h Secretion of IL-1β to BAL fluid before and after in vivo RV-A16 infection in (g) controls (n = 9) and (h) patients with asthma (n = 19, before; n = 18, after). Data are presented as arbitrary units (arb. units). i, j Representative confocal images of caspase-1 in bronchial biopsies at baseline and after in vivo RV-A16 infection, scale bars: 20 μm. Quantification based on the mean fluorescence intensity (MFI) x103: 10 equal epithelial areas from each biopsy (demonstrated as circles, squares, triangles, or diamonds) of control subjects (n = 3) and patients with asthma (n = 3, before; n = 4, after). Patients with asthma are presented in red, control individuals are presented in blue. (n) indicates the number of biologically independent samples examined from one in vivo RV-A16 infection. Heatmap displays normalized gene expression across the groups (row normalization). Transcriptome data analyzed with Bioconductor microarray analysis workflow [https://www.bioconductor.org/packages/release/workflows/vignettes/arrays/inst/doc/arrays.html], raw p-value presented. Asterisks represent statistical significance, p-value: *<0.05; **<0.005; ***<0.0005, ****<0.00005. Bar graph data present mean ± SEM analyzed with one-way ANOVA (Kruskal–Wallis test), RM one-way ANOVA (Friedman test), mixed-effects model with post-hoc analysis as appropriate, or paired two-tailed T-test or Wilcoxon test, as appropriate, depending on the data relation and distribution. Source data are provided as Source Data files. Arb. units arbitrary units; BAL Bronchoalveolar lavage, MFI mean fluorescence intensity, RV-A16 rhinovirus A16.
Fig. 2
Fig. 2. Augmented rhinovirus-induced RIG-I, but not NLRP3 inflammasome activation in bronchial epithelium in asthma.
a Representative Western Blot images of secreted IL-1β (apical compartment), and pro-IL-1β, ASC, pro-caspase-1 and β-actin (cell lysates) in in vitro-cultured HBECs from control subjects (n = 3, left panel) and patients with asthma (n = 3, right panel). b IL-1β release to the apical compartment assessed by ELISA in in vitro-cultured HBECs from control (n = 22, vehicle; n = 14, UV-RV-A16; n = 23, RV-A16) and asthma (n = 17, vehicle; n = 14, UV-RV-A16; n = 18, RV-A16). c Representative confocal images of ASC speck formation in in vitro-cultured HBECs from control individuals and patients with asthma (control n = 3, asthma n = 3); scale bars: 10 μm. d Quantification of ASC specks, presented as a number of specks (mean from 5–11 equal epithelial areas from two/three technical replicates from control n = 3, asthma n = 3). e IL-1β release to the apical compartment assessed by ELISA (n = 6, HDM; n = 7, HDM + RV-A16, HDM + RV-A16 + YVAD) in in vitro-cultured HBECs from patients with asthma in the presence or absence of caspase-1 inhibitor (YVAD). f Expression of RV-A16 positive strand (RV-A16 viral RNA) in in vitro-cultured HBECs from patients with asthma and controls (n = 16, vehicle, ICAM-1, RV-A16, RV-A16 + ICAM-1; n = 8, UV-RV-A16) after anti-ICAM-1 treatment was assessed using RT-PCR and presented as a relative quantification (RQ = 2-ΔΔCt) as compared to the vehicle condition. g IL-1β release to the apical supernatants assessed by ELISA in in vitro–cultured HBECs from patients with asthma and healthy controls (n = 10, vehicle, ICAM-1, RV-A16, RV-A16 + ICAM-1; n = 3, UV-RV-A16) in the presence or absence of anti-ICAM-1 combined with RV-A16 infection. e-g Data are presented as the percentage of the response after in vitro RV-A16 treatment. h Representative Western Blot images of RIG-I protein expression in in vitro-cultured HBECs from patients with asthma (n = 4). i Representative confocal images of RIG-I in in vitro-cultured HBECs from patients with asthma (n = 3); scale bars: 10 μm. j Co-immunoprecipitation (co-IP) of ASC/RIG-I complex using anti-ASC antibodies followed by RIG-I detection in the presence of HDM in in vitro-cultured HBECs from patients with asthma (n = 4). k Co-immunoprecipitation (co-IP) of ASC/MDA5 complex using anti-ASC antibodies followed by MDA5 detection in in vitro-cultured HBECs from patients with asthma (n = 3). l Representative Western Blot images of NLRP3 protein in in vitro-cultured HBECs from patients with asthma (n = 4). m Representative confocal images of NLRP3 and Occludin in vitro-cultured HBECs from patients with asthma in the presence of HDM (n = 3), scale bars: 10 μm. n IL-1β release to the apical compartment in in-vitro-cultured HBECs with/without RV-A16 and NLRP3 inflammasome inhibitor (MCC950) (control n = 3, asthma n = 3). HBECs from patients with asthma are presented in red, HBECs from control individuals are presented in blue. (n) indicates the number of biologically independent samples examined over at least three independent experiments. Bar graph data show mean ± SEM analyzed with one-way ANOVA (Kruskal–Wallis test), RM one-way ANOVA (Friedman test) or mixed-effects model with post-hoc analysis, as appropriate, depending on the data relation (paired or unpaired) and distribution. Source data are provided as Source Data files. anti-ICAM-1, anti-ICAM-1 antibody; Co-IP Co-immunoprecipitation, HBECs human bronchial epithelial cells, HDM house dust mite, IC Isotype control, IP Ab antibodies used for co-precipitation, MCC950, NLRP3 inflammasome inhibitor; RV-A16 rhinovirus A16; UV-RV-A16 UV-treated rhinovirus A16; YVAD YVAD- (caspase-1 inhibitor).
Fig. 3
Fig. 3. Activation of the RIG-I inflammasome impaired RIG-I-dependent interferon signaling in bronchial epithelium of patients with asthma.
a Volcano plots of all (black), significant (red), and significant antiviral (green) genes in bronchial brushings from controls (upper panel) and patients with asthma (lower panel) after in vivo RV-A16 infection (control n = 7, asthma n = 17). b Heatmap of antiviral genes significantly changed four days after in vivo RV-A16 infection in healthy controls (left panel) and/or in patients with asthma (right panel) presented together with the log2 fold change (FC) (black bars) (control n = 7, asthma n = 17). Yellow and grey left-side color bars represent genes upregulated and downregulated, respectively. c, d RV-A16 virus load in (c) the bronchoalveolar lavage (BAL) fluid and d the nasal lavage (NL) fluid in control individuals and patients with asthma four days after in vivo RV-A16 infection (control n = 9, asthma n = 19). Data presented as viral RNA copies per 1 mL of BAL/NL. e–j in vitro-cultured HBECs from patients with asthma were infected in vitro with RV-A16 in the presence or absence of BX795, a chemical inhibitor of TBK1 and IKKε, or vehicle. mRNA expression of (e) IFNL2/3 (IFNλ) and (f) DDX58 (RIG-I) assessed using RT-PCR and presented as relative quantification (RQ = 2-ΔΔCt) as compared to the vehicle condition (n = 5). g Secretion of CXCL10, CXCL11, CCL3, and CCL4 proteins into the apical compartment assessed with the Proximity Extension Assay (PEA) targeted proteomics (n = 6). Expression of (h) RV-A16 positive strand (RV-A16 viral RNA) and (i) IL1B (IL-1β) assessed using RT-PCR and presented as relative quantification (RQ = 2-ΔΔCt) (n = 5). j IL-1β release to the apical compartment of in vitro-cultured HBECs from patients with asthma assessed by ELISA (n = 8). k–n in vitro-cultured HBECs from patients with asthma were infected in vitro with RV-A16 in the presence or absence of YVAD, a caspase-1 inhibitor or vehicle. mRNA expression of (k) IFNB (IFNβ) and (l) DDX58 (RIG-I) (n = 4). Data are demonstrated as the percentage of the expression normalized to the in vitro RV-A16 condition. m Secretion of CXCL10, CXCL11, CCL3, and CCL4 into apical compartment assessed with the PEA proteomics (n = 6). n RIG-I release to the apical compartment assessed by PEA in in vitro-cultured HBECs from patients with asthma (n = 5). o Representative confocal images of RIG-I expression in bronchial biopsies at baseline, scale bars: 20 μm. Quantification based on the mean fluorescence intensity (MFI) x103: 10 equal epithelial areas from each biopsy (demonstrated as circles, squares, triangles, or diamonds) of control subjects (n = 3) and patients with asthma (n = 3). Fig. 3a–d, (o) presents in vivo RV-A16 infection study, Fig. 3e–n shows in vitro ALI-differentiated HBECs. Patients with asthma/HBECs from patients with asthma are presented in red, control individuals/HBECs from control individuals are presented in blue. (n) indicates the number of biologically independent samples examined over one infection (in vivo RV-A16 infection) or at least three independent experiments (in vitro-cultured HBECs). Heatmap displays normalized gene expression across the groups (row normalization). Transcriptome data analyzed with Bioconductor microarray analysis workflow [https://www.bioconductor.org/packages/release/workflows/vignettes/arrays/inst/doc/arrays.html], raw p-value presented. Asterisks represent statistical significance, p-value: *<0.05; **<0.005; ***<0.0005, ****<0.00005. Bar graph data present mean ± SEM analyzed with one-way ANOVA (Kruskal–Wallis test), RM one-way ANOVA (Friedman test), or mixed-effects model with post-hoc analysis, as appropriate, depending on the data relation and distribution. Proximity Extension Assay (PEA) targeted proteomics data were analyzed by Bioconductor limma package, raw p-value presented, and presented as normalized protein expression (NPX). Source data are provided as Source Data files. ALI Air-liquid interface, BAL bronchoalveolar lavage; BX795, TBK1/IKKε inhibitor; HBECs differentiated human bronchial epithelial cells, MFI mean fluorescent intensity, NL nasal lavage, NPX normalized protein expression, RV-A16 rhinovirus A16, YVAD ac-YVAD-cmk (caspase-1 inhibitor).
Fig. 4
Fig. 4. House dust mite enhanced rhinovirus-induced inflammasome activation in bronchial epithelium in asthma.
a Representative Western Blot images of secreted IL-1β (apical compartment), and pro-IL-1β, ASC, pro-caspase-1 and β-actin (cell lysates) in in vitro-cultured HBECs from control subjects (n = 3, left panel) and patients with asthma (n = 3, right panel). b IL-1β release to the apical compartment in in vitro-cultred HBECs from controls (n = 22, vehicle, HDM; n = 14 UV-RV-A16, HDM + UV-RV-A16; n = 23, RV-A16, HDM + RV-A16; n = 21, HDM + RV-A16) and patients asthma (n = 17, vehicle; n = 14, UV-RV-A16; n = 16, HDM + UV-RV-A16; n = 18, RV-A16; n = 19, HDM, HDM + RV-A16) assessed by ELISA. c Representative confocal images of IL-1β in in vitro-cultured HBECs from patients with asthma (n = 3); scale bars: 10 μm. d Representative confocal images of ASC speck formation in in vitro-cultured HBECs from control individuals (n = 3) and patients with asthma (n = 3); scale bars: 10 μm. e Quantification of ASC specks, presented as a number of specks (mean from 5–11 equal epithelial areas from two technical replicates from control n = 3, asthma n = 3). f RIG-I release to the apical compartment assessed by the PEA in in vitro-cultured HBECs from patients with asthma (n = 5). Data are presented as normalized protein expression (NPX). g Representative Western Blot images of secreted IL-1β (apical compartment), and pro-IL-1β and β-actin (cell lysates) in in vitro-cultured HBECs from control subjects (n = 3, left panel) and patients with asthma (n = 3, right panel). h IL-1β release to the apical compartment assessed by ELISA in in vitro-cultured HBECs from patients with asthma (n = 7) and healthy controls (n = 6) in indicated conditions. i Representative Western Blot images of secreted IL-1β (apical compartment), and pro-IL-1β and β-actin (cell lysates) in in vitro-cultured HBECs from control subjects (n = 3, left panel) and patients with asthma (n = 3, right panel) after DEP + RV-A16 treatment. j IL-1β release to the apical compartment assessed by ELISA in in vitro-cultured HBECs from patients with asthma (n = 3) and healthy controls (n = 4). HBECs from patients with asthma are presented in red, HBECs from control individuals are presented in blue. (n) indicates the number of biologically independent samples examined over at least three independent experiments. Bar graph data show mean ± SEM analyzed with one-way ANOVA (Kruskal–Wallis test), RM one-way ANOVA (Friedman test) or mixed-effects model with post-hoc analysis, as appropriate, depending on the data relation (paired or unpaired) and distribution. Green p-values demonstrate differences between marked condition and vehicle. Purple p-values demonstrate differences between HDM stimulation vs the same condition without HDM. PEA data were analyzed by Bioconductor limma package, raw p-value presented. Vehicle conditions from the same experiments presented on Fig. 2. Source data are provided as Source Data files. DEP diesel exhaust particles, HBECs human bronchial epithelial cells, HDM house dust mite, H-HDM heat-inactivated HDM, IC Isotype control, NPX normalized protein expression, RV-A16 rhinovirus A16, UV-RV-A16 UV-treated rhinovirus A16.
Fig. 5
Fig. 5. House dust mite impaired interferon responses in rhinovirus-infected bronchial epithelium of patients with asthma.
a mRNA expression of IFNB (IFN-β) (upper panel) in in vitro-cultured HBECs from controls (n = 9, vehicle, RV-A16; n = 8, HDM; n = 7, HDM + RV-A16) and asthma (n = 7, vehicle; n = 9, HDM, RV-A16; n = 12, HDM + RV-A16), and DDX58 (RIG-I) (lower panel) in in vitro-cultured HBECs from controls (n = 10) and asthma (n = 8, vehicle; n = 9, HDM, RV-A16; n = 11, HDM + RV-A16) assessed using RT-PCR and presented as relative quantification (RQ = 2-ΔΔCt) as compared to the vehicle condition. b Visualization of interaction network of significant proteins secreted to the apical compartment in in vitro-cultured HBECs from control individuals (n = 5, left panel) and patients with asthma (n = 8, right panel) after in vitro treatment with HDM + RV-A16, when compared to RV-A16 infection alone assessed with PEA targeted proteomics. Network nodes represent log2FC of significantly upregulated (red), and downregulated (blue) proteins; proteins not interacting with each other are not shown. Edges represent protein-protein interactions. Proteins enriched in viral infection or cytokine-mediated signaling pathway are marked with blue and red eclipses, respectively. c Expression of CXCL10, CXCL11, CCL3, and CCL4 in the apical compartment of in vitro-cultured HBECs from patients with asthma pre-treated with HDM or vehicle, followed by the in vitro infection with RV-A16 in the presence of BX795 or vehicle and assessed with PEA proteomics (n = 5). Data presented as the percentage of the response to the RV-A16 condition. HBECs from patients with asthma are presented in red, HBECs from control individuals are presented in blue. (n) indicates the number of biologically independent samples examined over at least three independent experiments. Bar graph data present mean ± SEM analyzed with one-way ANOVA (Kruskal–Wallis test), RM one-way ANOVA (Friedman test) or mixed-effects model with post-hoc analysis, as appropriate, depending on the data relation and distribution. PEA data were analyzed by Bioconductor limma package, raw p-value presented. Source data are provided as Source Data files. BX795, TBK1/IKKε inhibitor; HBECs differentiated human bronchial epithelial cells, HDM house dust mite, RV-A16 rhinovirus A16.
Fig. 6
Fig. 6. Rhinovirus and SARS-CoV-2 co-infection augmented epithelial inflammation after house dust mite exposure in asthma.
a Overview of the in vitro RV-A16 and severe acute respiratory syndrome coronavirus 2 (SARS-CoV-2) co-infection with/without HDM pre-treatment. b Representative confocal images of SARS-CoV-2 nucleocapsid (N) protein and ACE2 in in vitro-cultured HBECs from patients with asthma after SARS-CoV-2 infection (n = 3); scale bars: 10 μm. Expression of SARS-CoV-2 virus load (average expression of N protein, S protein and ORF1AB) and RV-A16 positive strand (RV-A16 viral RNA) in in vitro-cultured HBECS from (c) healthy controls (n = 6) and d patients with asthma (n = 7) was assessed using RT-PCR and presented as relative quantification (RQ = 2-ΔΔCt) compared to medium condition separately for HBECs from controls and patients with asthma. e Correlation of log10-transformed RV-A16 and SARS-CoV-2 viral loads in in vitro-cultured HBECs from patients with asthma (n = 7) and healthy controls (n = 6). f Heatmap of gene expression in in vitro-cultured HBECs from healthy controls (n = 6, left panel) and patients with asthma (n = 7, right panel) assessed using RT-PCR and transformed from relative quantification (RQ = 2-ΔΔCt). g Heatmap of secreted proteins assessed in the apical compartments of in vitro-cultured HBECs from controls (n = 6, left panel) and patients with asthma (n = 7, right panel) after in vitro HDM pre-stimulation and RV-A16 and SARS-CoV-2 co-infection analyzed with the quantitative PEA targeted proteomics. Data are transformed from the concentrations in pg/mL. h IL-18, IL-33, and CCL4 secreted to the apical compartment after in vitro SARS-CoV-2 infection in in vitro-cultured HBECs from healthy controls (n = 6) and patients with asthma (n = 7) measured with the quantitative PEA. i Interaction network analysis of all detected proteins secreted to the apical compartment of in vitro-cultured HBECs from control individuals (n = 6, top panel) and patients with asthma (n = 7, bottom panel) after in vitro treatment with HDM + RV-A16 + SARS-CoV-2, when compared to RV-A16 + SARS-CoV-2 assessed with quantitative PEA. Network nodes represent log2FC of significantly upregulated (red), and downregulated (blue) proteins. Edges represent protein-protein interactions. Significantly changed proteins are indicated by asterisks (*). j IL-33 secreted to the apical compartment after in vitro HDM prestimulation and RV and SARS-CoV-2 coinfection in in vitro-cultured HBECs from healthy controls (n = 6) and patients with asthma (n = 7) measured with the quantitative PEA. HBECs from patients with asthma are presented in red, HBECs from control individuals are presented in blue. (n) indicates the number of biologically independent samples examined over two independent experiments. Black p-values demonstrate differences between marked conditions and vehicle. Black or white asterisks (*) represent a significant difference as compared to the vehicle from the same group. Green asterisks (*) represent a significant difference between HDM + SARS-CoV-2 vs SARS-CoV-2 conditions, red asterisks (*) represent a significant difference between HDM prestimulation combined with RV-A16 and SARS-CoV-2 coinfection compared to infection with both viruses without HDM. Bar graphs depict the mean ± SEM, whereas color-coded circles show individual data from the same donor. Data are presented as mean ± SEM analyzed with one-way ANOVA (Kruskal–Wallis test), RM one-way ANOVA (Friedman test) or mixed-effects model, with post-hoc analysis as appropriate, depending on the data relation and distribution, *p-value ≤0.05, **p-value ≤0.01, ***p-value ≤0.001, ****p-value ≤0.0001. Correlation between viral loads was calculated with Spearman’s rank correlation. Source data are provided as Source Data files. HBECs Human Bronchial Epithelial Cells, HDM House Dust Mite, IC isotype control, RV-A16 rhinovirus A16, SARS-CoV-2 Severe Acute Respiratory Syndrome Coronavirus 2.

References

    1. Devereux G. The increase in the prevalence of asthma and allergy: food for thought. Nat. Rev. Immunol. 2006;6:869–874. doi: 10.1038/nri1958. - DOI - PubMed
    1. Global Initiative for Asthma. Global strategy for asthma management and prevention, 2020. Available from: www.ginasthma.org. (2020).
    1. Papadopoulos NG, et al. Viruses and bacteria in acute asthma exacerbations–a GA(2) LEN-DARE systematic review. Allergy. 2011;66:458–468. doi: 10.1111/j.1398-9995.2010.02505.x. - DOI - PMC - PubMed
    1. Kim CK, Callaway Z, Gern JE. Viral infections and associated factors that promote acute exacerbations of asthma. Allergy Asthma Immunol. Res. 2018;10:12–17. doi: 10.4168/aair.2018.10.1.12. - DOI - PMC - PubMed
    1. Kiang D, et al. Molecular characterization of a variant rhinovirus from an outbreak associated with uncommonly high mortality. J. Clin. Virol.: Off. Publ. Pan Am. Soc. Clin. Virol. 2007;38:227–237. doi: 10.1016/j.jcv.2006.12.016. - DOI - PubMed

Publication types

MeSH terms