. 2023 Sep;79(3):728-740.
doi: 10.1016/j.jhep.2023.04.013. Epub 2023 Apr 23.

Hepatocyte dedifferentiation profiling in alcohol-related liver disease identifies CXCR4 as a driver of cell reprogramming

Affiliations

Hepatocyte dedifferentiation profiling in alcohol-related liver disease identifies CXCR4 as a driver of cell reprogramming

Beatriz Aguilar-Bravo et al. J Hepatol. 2023 Sep.

Abstract

Background & aims: Loss of hepatocyte identity is associated with impaired liver function in alcohol-related hepatitis (AH). In this context, hepatocyte dedifferentiation gives rise to cells with a hepatobiliary (HB) phenotype expressing biliary and hepatocyte markers and showing immature features. However, the mechanisms and impact of hepatocyte dedifferentiation in liver disease are poorly understood.

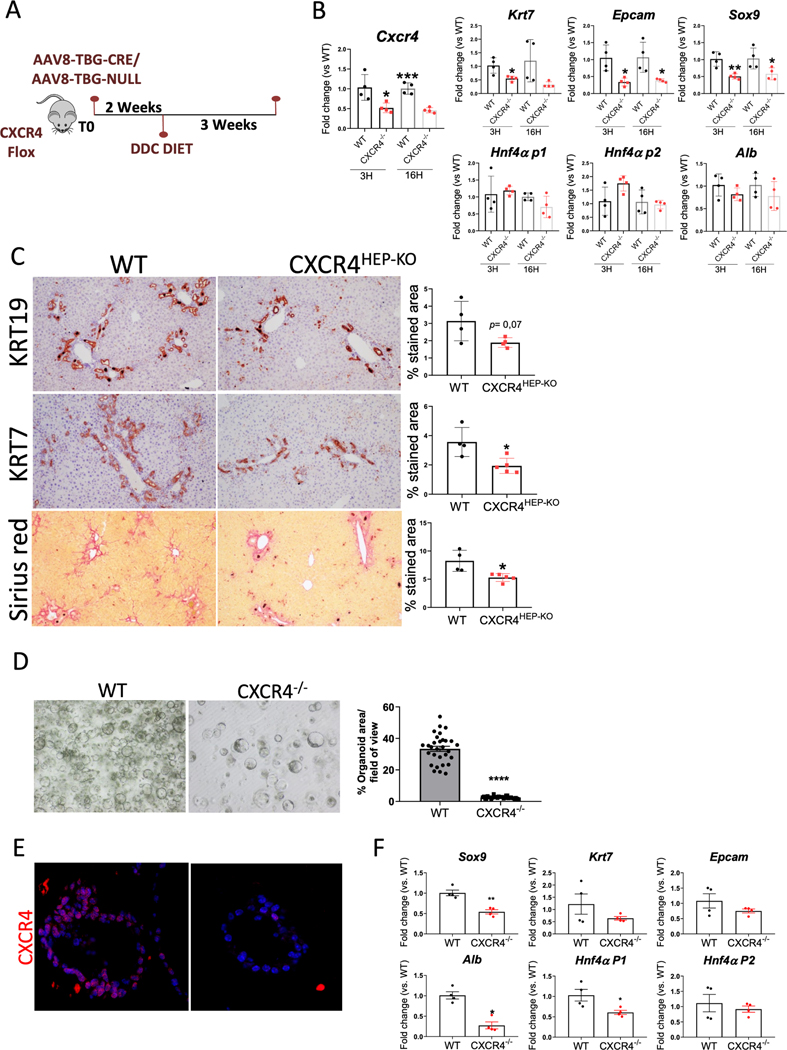
Methods: HB cells and ductular reaction (DR) cells were quantified and microdissected from liver biopsies from patients with alcohol-related liver disease (ArLD). Hepatocyte-specific overexpression or deletion of C-X-C motif chemokine receptor 4 (CXCR4), and CXCR4 pharmacological inhibition were assessed in mouse liver injury. Patient-derived and mouse organoids were generated to assess plasticity.

Results: Here, we show that HB and DR cells are increased in patients with decompensated cirrhosis and AH, but only HB cells correlate with poor liver function and patients' outcome. Transcriptomic profiling of HB cells revealed the expression of biliary-specific genes and a mild reduction of hepatocyte metabolism. Functional analysis identified pathways involved in hepatocyte reprogramming, inflammation, stemness, and cancer gene programs. The CXCR4 pathway was highly enriched in HB cells and correlated with disease severity and hepatocyte dedifferentiation. In vitro, CXCR4 was associated with a biliary phenotype and loss of hepatocyte features. Liver overexpression of CXCR4 in chronic liver injury decreased the hepatocyte-specific gene expression profile and promoted liver injury. CXCR4 deletion or its pharmacological inhibition ameliorated hepatocyte dedifferentiation and reduced DR and fibrosis progression.

Conclusions: This study shows the association of hepatocyte dedifferentiation with disease progression and poor outcome in AH. Moreover, the transcriptomic profiling of HB cells revealed CXCR4 as a new driver of hepatocyte-to-biliary reprogramming and as a potential therapeutic target to halt hepatocyte dedifferentiation in AH.

Impact and implications: Here, we show that hepatocyte dedifferentiation is associated with disease severity and a reduced synthetic capacity of the liver. Moreover, we identify the CXCR4 pathway as a driver of hepatocyte dedifferentiation and as a therapeutic target in alcohol-related hepatitis. Therefore, this study reveals the importance of preserving strict control over hepatocyte plasticity in order to preserve liver function and promote tissue repair.

Keywords: Alcohol-related hepatitis; Cell plasticity; HNF4α; Hepatobiliary cells; Hepatocyte identity; Hepatocyte nuclear factor 4 alpha; Organoids.


Figures

Fig. 1
Fig. 1. Histological analysis of HB cells and DR cells in the progression of ArLD disease.
(A) KRT7 staining of liver biopsies from 3 patients with pre-cirrhosis, 4 patients with compensated cirrhosis, 13 patients with decompensated cirrhosis and 15 patients with AH (B) Representation of HB cell area (KRT7+ hepatocytes) and DR cell area (KRT7+ DR cells) along ArLD progression. Significant differences are indicated as *p<0.05 (T-student test). (C) Correlation between the area of HB cells and DR cells from ArLD biopsies. (D) Correlation between HB cells (%area) and (E) DR cells (%area) with the clinical and biochemical parameters associated with the ArLD cohort. The regression coefficient (r) and p-value of each correlation are indicated.
Fig. 2
Fig. 2. Transcriptomic analysis of microdissected samples from patients with AH.
(A) KRT7 staining of a liver explant with AH showing the three microdissected populations. DR cells (KRT7+ DR cells) in blue (n=4), HB cells (KRT7+ hepatocytes) in orange (n=3) and hepatocytes (KRT7 hepatocytes) in green (n=2). (B) Principal component analysis (PCA) showing the isolated populations that underwent RNA sequencing. Each sample is positioned in the two-dimensional space according to its RNA expression. (C) GSEA of the hepatocyte-to-biliary gene signature (hepatocytes<HB<DR) (upper panel) and the hepatocyte gene signature (hepatocytes>HB>DR) (bottom panel) in a data set of transcriptomic data from AH vs. ASH patients. Normalized enrichment score (NES) and significance is shown. (D) Balloon plot summarizing scaled average expression values of hepatic and biliary genes in the three populations, hepatocytes (HC), HB cells and DR cells. Red and blue dots represent positive and negative enrichment, respectively. (E) Representative staining of biliary (EPCAM, KRT7, SOX9 and TROP2) and hepatocyte (HEP-PAR1) markers in paraffin embedded liver sections from patients with AH. Hepatocytes (HC), HB and DR cells are indicated. (F) Balloon plot showing selected GSEA in the three populations (HC, HB, DR). Red spots represent activated gene sets and blue spots represent down-regulated gene sets.
Fig. 3
Fig. 3. Transcriptomic analysis of HB cells and its association with ArLD severity.
(A) Volcano plots of differentially expressed genes in HB cells vs. hepatocytes or (B) vs. DR cells. Selected genes from each panel are annotated. (C) IPA analysis of enriched canonical pathways in HB cells vs. hepatocytes or (D) HB cells vs. DR cells. Inhibited pathways are represented in blue, activated pathways are represented in red, and pathways with no status information are represented in white. The pathway significance is shown as -log(p-value). (E) IPA prediction of activated upstream regulators in HB cells vs. hepatocytes or (F) activated upstream regulators in HB cells vs. DR cells. Upstream regulators with a z-score>2 was annotated. (G) Heat map illustrating the HB gene signature along ArLD progression. Red color indicates up-regulated gene expression, while blue color shows decreased gene expression. ASH, alcohol-related steatohepatitis; comp CH, compensated cirrhosis; AH, alcohol-related hepatitis; nr, non-responders; r, responders. Gene correlation with clinical parameters is shown in Table S9 (H) Protein interaction network of HB gene signature. 10 out of 39 genes were clustered and 8 additional genes were added by String software. Line thickness indicates the strength of data support.
Fig. 4
Fig. 4. CXCR4 expression correlates with loss of hepatocyte identity and bad prognosis in AH.
(A) Normalized counts of CXCR4 in hepatocytes, HB cells and DR cells. Significant differences are indicated as *p<0,05 (T-student test). (B) Representative staining of CXCR4 and double immunofluorescence with EPCAM and (C) CXCL12 on liver sections from AH patients. HC, HB and DR cells are indicated. (D-E) Correlation of CXCR4 expression with 4 specific gene sets: CXCL-family genes, hepatocyte markers, biliary markers, and epithelial-to-mesenchymal markers (D) and correlation with clinical parameters (E). Transcriptomic data from AH patients was used as the data set. The regression coefficient (r) and p-value of each correlation are annotated. (F) qPCR gene expression of AH-related human organoids incubated for 24h with the cholangiocyte organoid medium (BEC medium). Significant differences are indicated as *p<0,05 (T-student test). (G) Representative double immunofluorescence of CXCR4 and EPCAM of AH-related human organoids growth in cholangiocyte medium.
Fig. 5
Fig. 5. CXCR4 induces liver injury progression and loss of hepatocyte identity.
(A) Experimental strategy to induce Cxcr4 overexpression. (B) qPCR confirmation of Cxcr4 overexpression in control (n=4) and DDC-injured mice (n=7). Gene expression is shown as Fc vs. AAV8-Ctrl. *p<0,05 compared to AAV8-Ctrl. #p<0,05 compared to AAV8-ctrl DDC 1wk (T-student test). (C) Representative images of CXCR4 staining in control and DDC experimental groups. (D) qPCR gene expression of hepatocyte-specific markers in DDC experimental groups. Data is shown as Fc vs. AAV8-Ctrl. *p<0.05 compared to Ctrl (T-student test). (E) Immunohistochemistry images of KRT19, MPO, and the fibrosis staining Sirius red on DDC-treated groups, AAV8-Ctrl (n=4) and AAV8-CXCR4 (n=7). Stained area quantification of both experimental groups is shown. Significant differences are indicated as *p<0.05 (T-student test)
Fig. 6
Fig. 6. CXCR4 specific deletion in hepatocytes ameliorates hepatocyte reprogramming, DR expansion and liver fibrosis
(A) Experimental strategy to induce CXCR4 specific deletion in hepatocytes (B) qPCR of Cxcr4, Cxcl12, DR and hepatocyte markers on isolated primary hepatocytes from AAV8-Ctrl (WT; n=4) and AAV8-CRE treated mice (CXCR4−/−; n=4). (C) Representative images of KRT19, KRT7 and Sirius red on DDC-treated groups, AAV8-Ctrl (WT; n=4) and AAV8-CRE (CXCR4HEP-KO; n=5). Stained area quantification of both experimental groups is shown. Significant differences are indicated as *p<0.05 (T-student test) (D) Representative image of primary hepatocytes derived-organoids generated from AAV8-Ctrl (WT) and AAV8-CRE treated mice (KO). % Organoids area per field of view is shown. (E) Representative immunofluorescence of CXCR4 in primary hepatocytes derived- organoids generated from AAV8-Ctrl (WT; n=4)) and AAV8-CRE treated mice (KO; n=4). (F) qPCR gene expression of biliary and hepatocyte markers in mice derived-organoids. Gene expression is shown as Fc vs. WT. Significant differences are indicated as *p<0,05 (T-student test).
Fig. 7
Fig. 7. Inhibition of CXCL12/CXCR4 pathway reduces chronic liver injury
(A) Experimental strategy to inhibit the CXCL12/CXCR4 pathway (B) qPCR gene expression of Cxcr4 in the three experimental conditions (n=6 mice per condition). Gene expression is shown as Fc vs. Vehicle (C) Immunohistochemistry images of KRT19, SOX9, MPO and the fibrosis staining Sirius red. Stained area quantification for each group is shown. Significant differences are indicated as *p<0.05 (T-student test). Images are representative of n=6 mice per condition.

Update of

References

    1. Altamirano J, Miquel R, Katoonizadeh A, Abraldes JG, Duarte-Rojo A, Louvet A, et al. A histologic scoring system for prognosis of patients with alcoholic hepatitis. Gastroenterology 2014;146. 10.1053/j.gastro.2014.01.018. - DOI - PMC - PubMed
    1. Argemi J, Latasa MU, Atkinson SR, Blokhin IO, Massey V, Gue JP, et al. Defective HNF4alpha-dependent gene expression as a driver of hepatocellular failure in alcoholic hepatitis. Nat Commun 2019. 10.1038/s41467-019-11004-3. - DOI - PMC - PubMed
    1. Bataller R, Arab JP, Shah VH. Alcohol-Associated Hepatitis. N Engl J Med 2022;387:2436–48. 10.1056/NEJMRA2207599. - DOI - PubMed
    1. Lucey MR, Mathurin P, Morgan TR. Alcoholic hepatitis. N Engl J Med 2009;360:2758–69. 10.1056/NEJMra0805786. - DOI - PubMed
    1. Tanimizu N, Nishikawa Y, Ichinohe N, Akiyama H, Mitaka T. Sry HMG box protein 9-positive (Sox9+) epithelial cell adhesion molecule-negative (EpCAM-) biphenotypic cells derived from hepatocytes are involved in mouse liver regeneration. J Biol Chem 2014;289:7589–98. 10.1074/jbc.M113.517243. - DOI - PMC - PubMed

Publication types

Substances