. 2023 Apr;34(4):383-393.
doi: 10.5152/tjg.2023.22590.

Identification of Hub Genes and Immune Infiltration in Non-alcoholic Fatty Liver Disease -Related Hepatocellular Carcinoma by Bioinformatics Analysis

Affiliations

Identification of Hub Genes and Immune Infiltration in Non-alcoholic Fatty Liver Disease -Related Hepatocellular Carcinoma by Bioinformatics Analysis

Xu Liu et al. Turk J Gastroenterol. 2023 Apr.

Abstract

Background: Non-alcoholic fatty liver disease has been a significant risk factor for hepatocellular carcinoma. In the study, we aimed to identify the key genes associated with the transition from non-alcoholic fatty liver disease to hepatocellular carcinoma through bioinformatics analysis.

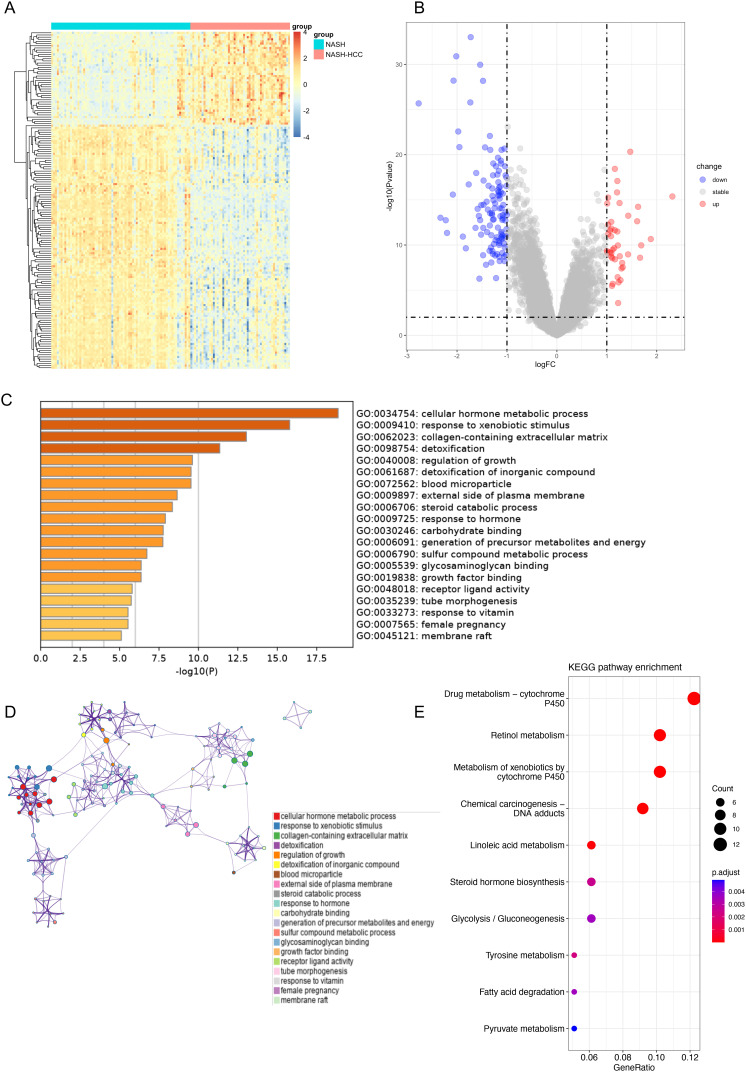
Methods: The GSE164760 dataset was used for identifying differentially expressed genes. Gene Ontology and Kyoto Encyclopedia of Genes and Genomes enrichment analysis were performed to explore the potential function of the differentially expressed genes. Subsequently, the protein-protein interaction network was constructed to select hub genes, and the immune cell infiltration was analyzed. Finally, the receiver operating characteristic analysis was performed to assess the diagnostic ability of the crucial genes.

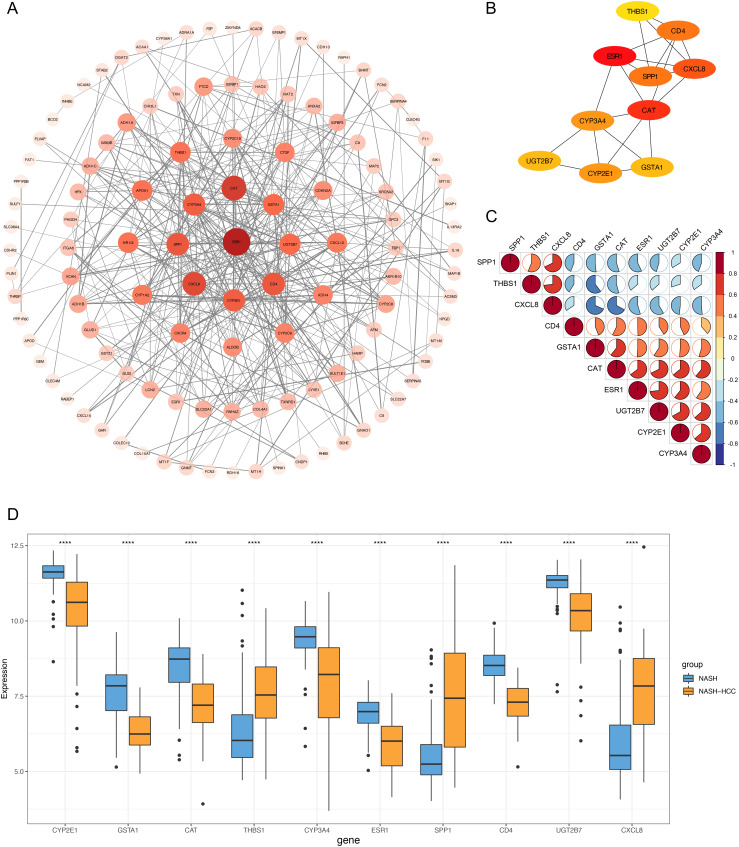
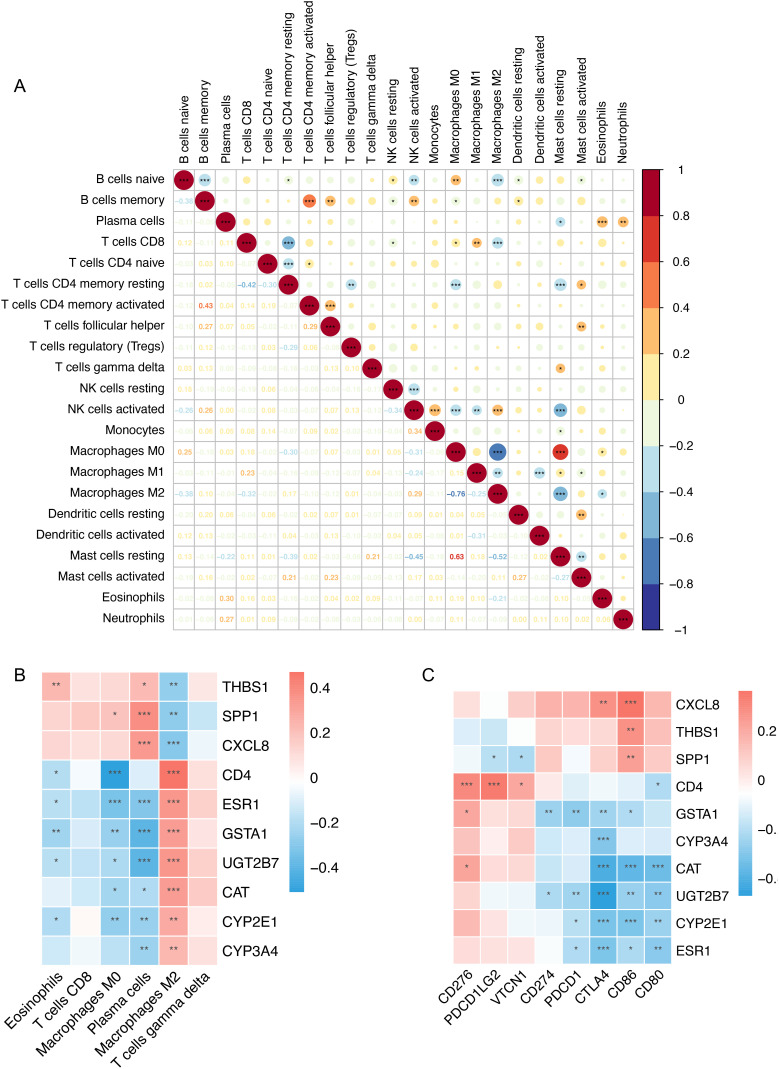
Results: A total of 156 differentially expressed genes were identified. Gene Ontology enrichment analysis indicated that differentially expressed genes were strongly associated with cellular hormone metabolic process, response to xenobiotic stimulus, collagen-containing extracellular matrix, detoxification, and regulation of growth. In the protein-protein interaction network, ESR1, CAT, CXCL8, CD4, SPP1, CYP2E1, CYP3A4, UGT2B7, GSTA1 and THBS1 were selected as the hub genes. Immune infiltration analysis demonstrated that M0 macrophages, plasma cells, CD8+T cell and M2 macrophages were significantly changed in tumor tissues. Finally, we verified the hub gene expression and selected CD4, UGT2B7, and CYP3A4 as the potential diagnostic biomarkers.

Conclusion: CD4, UGT2B7, and CYP3A4 were selected as the potential diagnostic biomarkers of non-alcoholic fatty liver disease-hepatocellular carcinoma.


Conflict of interest statement

Declaration of Interests: The authors have no conflict of interest to declare.

Figures

Figure 1.
Figure 1.
Gene expression and enrichment analysis revealed DEGs in NASH-HCC tissues and their association with the process of material metabolism and regulation of growth. (A) Heatmap of all DEGs in NASH tissues and NASH-HCC tissues. (B) Volcano map of all DEGs when comparing NASH-HCC tissues to NASH tissues. Red indicates upregulated genes, blue represents downregulated genes, and grey means genes that were not differentially expressed. (C) Heatmap of GO enrichment terms of DEGs in Metascape, colored by P-value. (D) Network of GO enrichment terms, colored by cluster ID. (E) The dot plot of the top 10 terms of KEGG enrichment analysis. DEG, differentially expressed genes; GO, Gene Ontology; HCC, hepatocellular carcinoma; KEGG, Kyoto Encyclopedia of Genes and Genomes; NASH, non-alcoholic steatohepatitis.
Figure 2.
Figure 2.
Identification of hub genes. (A) Construction of the PPI network of DEGs. The color depth and shape size of the nodes are positively correlated with degree. (B) The top 10 hub genes at protein level. (C) The correlation between the 10 hub genes. Positive correlation was marked with red and negative with blue. (D) The expression of 10 hub genes in NASH tissues and NASH-HCC tissues in GSE164760. DEG, differentially expressed genes; HCC, hepatocellular carcinoma; NASH, non-alcoholic steatohepatitis; PPI, protein–protein interaction.
Figure 3.
Figure 3.
Immune cell infiltration analysis showed the different proportion of M0 macrophages, M2 macrophages, plasma cells, and CD8+T cells between NASH-HCC tissues and NASH tissues. (A) Composition of 22 immune cells in 74 NASH tissues. (B) Composition of 22 immune cells in 53 NASH-HCC tissues. (C) Fractions of 22 immune cells in 74 NASH tissues. (D) Fractions of 22 immune cells in 53 NASH-HCC tissues. (E) Comparisons of 22 immune cells between NASH tissues and NASH-HCC tissues. HCC, hepatocellular carcinoma; NASH, non-alcoholic steatohepatitis.
Figure 4.
Figure 4.
Correlation of hub genes and immune cells. (A) The correlation of 22 immune cells. Red represents positive correlation and blue represents negative correlation. Lower panel was Pearson’s correlation coefficient. In the upper panel, the size of the circle is positively correlated with the correlation coefficient. (B) The correlation between each hub gene and changed immune cells. Red, positive; blue, negative. (C) Correlation between the 10 hub genes and 8 immune checkpoint genes.
Figure 5.
Figure 5.
Hub gene verification and ROC analysis indicated that CD4, UGT2B7, and CYP3A4 may be the potential diagnostic biomarkers of NAFLD-HCC. (A) The differential expression of CD4, UGT2B7, and CYP3A4 in paired tumor tissues and adjacent tissues of GSE164441. (B) ROC analysis of CD4, UGT2B7, and CYP3A4 in GSE164760. (C) ROC analysis of CD4, UGT2B7, and CYP3A4 in GSE164441. HCC, hepatocellular carcinoma; NAFLD, non-alcoholic fatty liver disease; ROC, receiver operating characteristic.

Similar articles

Cited by

References

    1. Powell EE, Wong VW-S, Rinella M. Non-alcoholic fatty liver disease. Lancet. 2021;397(10290):2212 2224. ( 10.1016/S0140-6736(20)32511-3) - DOI - PubMed
    1. Eslam M, Valenti L, Romeo S. Genetics and epigenetics of NAFLD and NASH: clinical impact. J Hepatol. 2018;68(2):268 279. ( 10.1016/j.jhep.2017.09.003) - DOI - PubMed
    1. Friedman SL, Neuschwander-Tetri BA, Rinella M, Sanyal AJ. Mechanisms of NAFLD development and therapeutic strategies. Nat Med. 2018;24(7):908 922. ( 10.1038/s41591-018-0104-9) - DOI - PMC - PubMed
    1. Huang DQ, El-Serag HB, Loomba R. Global epidemiology of NAFLD-related HCC: trends, predictions, risk factors and prevention. Nat Rev Gastroenterol Hepatol. 2021;18(4):223 238. ( 10.1038/s41575-020-00381-6) - DOI - PMC - PubMed
    1. Pais R, Fartoux L, Goumard C, et al. Temporal trends, clinical patterns and outcomes of NAFLD-related HCC in patients undergoing liver resection over a 20-year period. Aliment Pharmacol Ther. 2017;46(9):856 863. ( 10.1111/apt.14261) - DOI - PubMed

MeSH terms