. 2023 Jul 19;243(0):321-338.
doi: 10.1039/d2fd00156j.

The origin of overpotential in lithium-mediated nitrogen reduction

Affiliations

The origin of overpotential in lithium-mediated nitrogen reduction

O Westhead et al. Faraday Discuss. .

Abstract

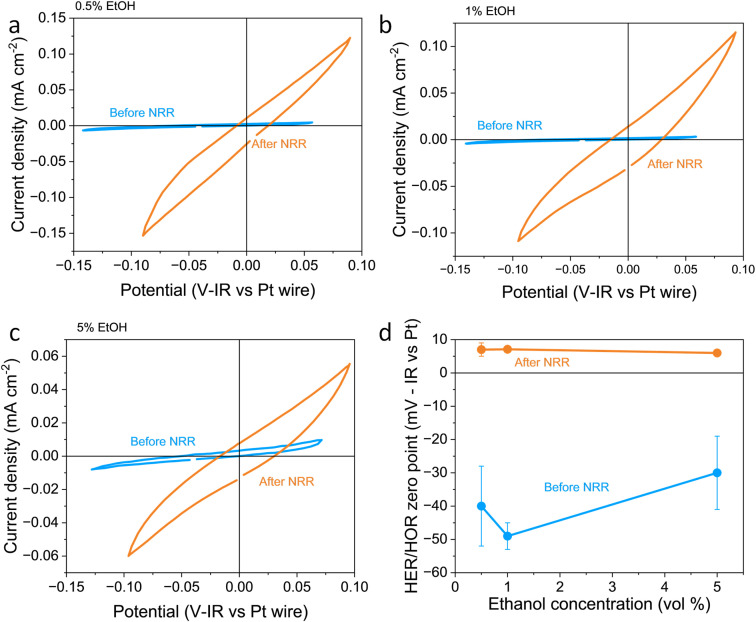
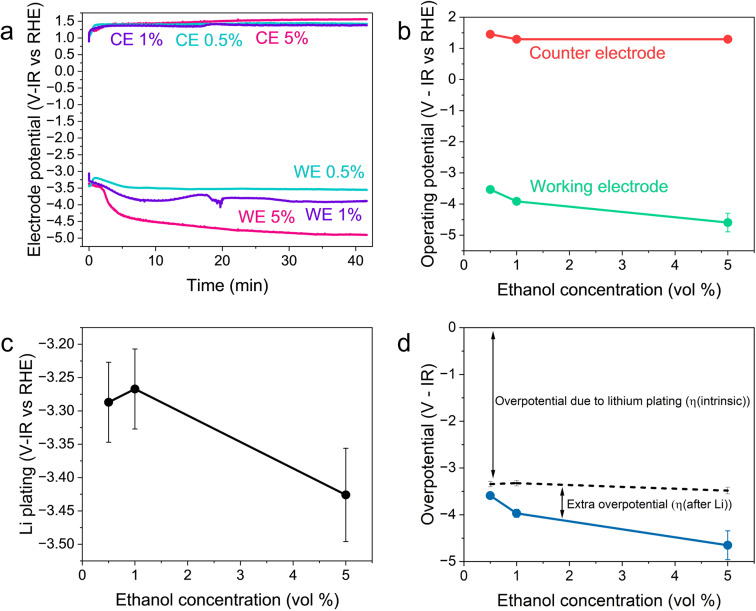
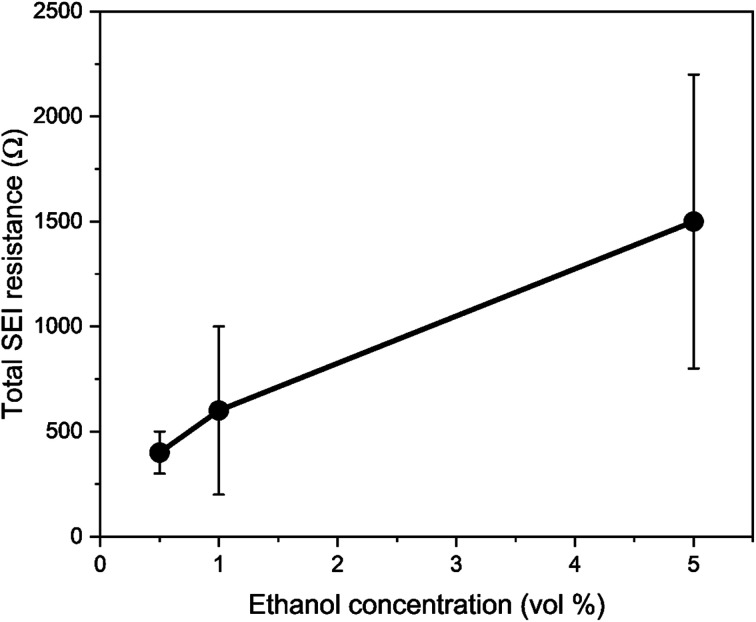
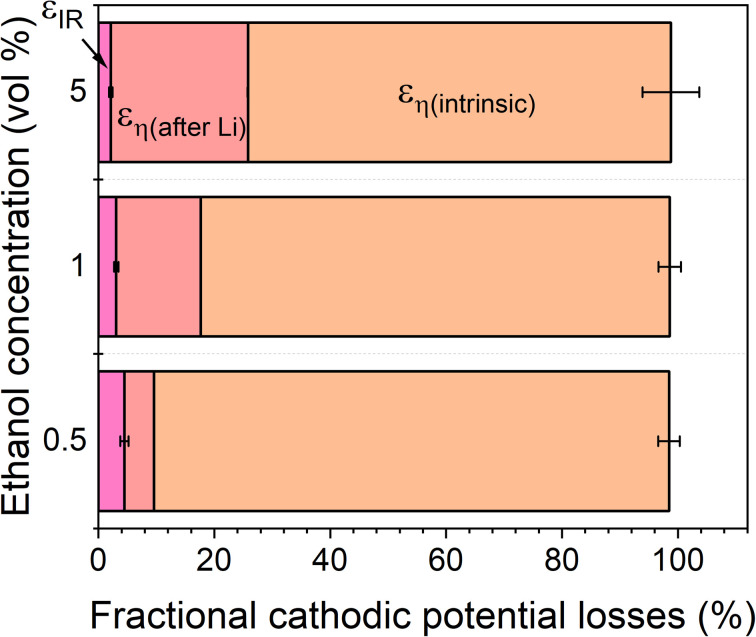
The verification of the lithium-mediated nitrogen reduction system in 2019 has led to an explosion in the literature focussing on improving the metrics of faradaic efficiency, stability, and activity. However, while the literature acknowledges the vast intrinsic overpotential for nitrogen reduction due to the reliance on in situ lithium plating, it has thus far been difficult to accurately quantify this overpotential and effectively analyse further voltage losses. In this work, we present a simple method for determining the Reversible Hydrogen Electrode (RHE) potential in the lithium-mediated nitrogen reduction system. This method allows for an investigation of the Nernst equation and reveals sources of potential losses. These are namely the solvation of the lithium ion in the electrolyte and resistive losses due to the formation of the solid electrolyte interphase. The minimum observed overpotential was achieved in a 0.6 M LiClO4, 0.5 vol% ethanol in tetrahydrofuran electrolyte. This was -3.59 ± 0.07 V vs. RHE, with a measured faradaic efficiency of 6.5 ± 0.2%. Our method allows for easy comparison between the lithium-mediated system and other nitrogen reduction paradigms, including biological and homogeneous mechanisms.


Conflict of interest statement

There are no conflicts to declare.

Figures

Fig. 1
Fig. 1. Plots to show the variation in reversible hydrogen electrode potential and hydrogen evolution and oxidation activity with ethanol content before and after a nitrogen reduction experiment. The electrolyte was 0.6 M LiClO4 in THF with varying ethanol content. The working electrode was a Pt foil, the counter electrode was a Pt mesh of higher surface area than the working electrode, and the reference was a Pt wire pseudo-reference. (a–c) show a representative fifth cyclic voltammogram from a single experiment taken at 20 mV s−1 under 1 bar hydrogen partial pressure before nitrogen reduction (in blue) and after nitrogen reduction (in orange) for 0.5, 1 and 5 vol% ethanol respectively. (d) shows the variation in the hydrogen evolution reaction (HER)/hydrogen oxidation reaction (HOR) zero-point potential before and after nitrogen reduction averaged for n = 3 separate experiments. Error bars smaller than points for 1 and 5 vol% ethanol after NRR. See ESI for full experimental details.
Fig. 2
Fig. 2. Plots to show the variation in operating potential and lithium plating potential during nitrogen reduction. After a 1 hour purge with N2 gas at 10 ml min−1 to remove any dissolved H2 gas, a linear sweep voltammogram was taken at 20 mV s−1 to determine the lithium plating potential and then a current density of −2 mA cm−2 was applied until −5 C of charge had passed. A molybdenum foil working electrode, Pt wire pseudo-reference and Pt mesh counter electrode were used. The electrolyte was 0.6 M LiClO4 in THF with varying concentrations of ethanol added. The thermodynamic equilibrium potential for nitrogen reduction is 0.057 V vs RHE. All potentials plotted are IR corrected. (a) Three representative chronopotentiometry experiments taken at −2 mA cm−2. (b) The average operating potentials across a chronopotentiometry experiment under an applied current density of −2 mA cm−2 for three different ethanol concentrations (n = 3). (c) The variation in lithium plating potential observed via linear sweep voltammetry (n = 3). For (a–c), the voltages are corrected for ohmic drop and converted to the measured RHE potential using the average values obtained from three separate experiments after a nitrogen reduction experiment, since these exhibited less variation (see Fig. 1d). (d) The calculated overpotential for nitrogen reduction, not including ohmic drop. The blue line represents the total overpotential. The dashed line represents the overpotential due to lithium plating (η(intrinsic)). The difference between the blue line and dashed line represents any extra overpotential after lithium plating (η(after Li)).
Fig. 3
Fig. 3. A plot to show the variation in total solid electrolyte interphase (SEI) resistance (charge transfer resistance (RCT) + SEI resistance (RSEI)) with ethanol concentration. Resistance values were obtained using potentiostatic electrochemical impedance spectroscopy (PEIS). Spectra were taken at open circuit potential after a nitrogen reduction experiment, which is at lithium plating potentials, at an amplitude of 10 mV between 200 kHz and 200 mHz. The total resistance is the sum of the resistance of the two observed semi-circles representing charge transfer resistance and SEI resistance. In general, increasing ethanol content leads to a higher total resistance (n = 3).
Fig. 4
Fig. 4. A plot to show the fractional potential losses in the cathodic reaction for the lithium-mediated nitrogen reduction system due to overpotential and ohmic losses for a 0.6 M LiClO4 in THF electrolyte with varying ethanol content. Fractional energy losses obtained using eqn (18) and (19).

References

    1. Smith C. Hill A. K. Torrente-Murciano L. Current and future role of Haber-Bosch ammonia in a carbon-free energy landscape. Energy Environ. Sci. 2020;13:331–344. doi: 10.1039/C9EE02873K. - DOI
    1. Chen J. G. Crooks R. M. Seefeldt L. C. et al., Beyond fossil fuel–driven nitrogen transformations. Science. 2018;360:eear6611. doi: 10.1126/science.aar6611. - DOI - PMC - PubMed
    1. Lazouski N. Schiffer Z. J. Williams K. et al., Understanding Continuous Lithium-Mediated Electrochemical Nitrogen Reduction. Joule. 2019;3:1127–1139. doi: 10.1016/j.joule.2019.02.003. - DOI
    1. Martín A. J. Shinagawa T. Pérez-Ramírez J. Electrocatalytic Reduction of Nitrogen: From Haber-Bosch to Ammonia Artificial Leaf. Chem. 2019;5:263–283.
    1. Tsuneto A. Kudo A. Sakata T. Lithium-mediated electrochemical reduction of high pressure N2 to NH3. J. Electroanal. Chem. 1994;367:183–188. doi: 10.1016/0022-0728(93)03025-K. - DOI