

Re-evaluation of the risks to public health related to the presence of bisphenol A (BPA) in foodstuffs
- PMID: 37089179
- PMCID: PMC10113887
- DOI: 10.2903/j.efsa.2023.6857
Re-evaluation of the risks to public health related to the presence of bisphenol A (BPA) in foodstuffs
Abstract
In 2015, EFSA established a temporary tolerable daily intake (t-TDI) for BPA of 4 μg/kg body weight (bw) per day. In 2016, the European Commission mandated EFSA to re-evaluate the risks to public health from the presence of BPA in foodstuffs and to establish a tolerable daily intake (TDI). For this re-evaluation, a pre-established protocol was used that had undergone public consultation. The CEP Panel concluded that it is Unlikely to Very Unlikely that BPA presents a genotoxic hazard through a direct mechanism. Taking into consideration the evidence from animal data and support from human observational studies, the immune system was identified as most sensitive to BPA exposure. An effect on Th17 cells in mice was identified as the critical effect; these cells are pivotal in cellular immune mechanisms and involved in the development of inflammatory conditions, including autoimmunity and lung inflammation. A reference point (RP) of 8.2 ng/kg bw per day, expressed as human equivalent dose, was identified for the critical effect. Uncertainty analysis assessed a probability of 57-73% that the lowest estimated Benchmark Dose (BMD) for other health effects was below the RP based on Th17 cells. In view of this, the CEP Panel judged that an additional uncertainty factor (UF) of 2 was needed for establishing the TDI. Applying an overall UF of 50 to the RP, a TDI of 0.2 ng BPA/kg bw per day was established. Comparison of this TDI with the dietary exposure estimates from the 2015 EFSA opinion showed that both the mean and the 95th percentile dietary exposures in all age groups exceeded the TDI by two to three orders of magnitude. Even considering the uncertainty in the exposure assessment, the exceedance being so large, the CEP Panel concluded that there is a health concern from dietary BPA exposure.
Keywords: BPA; Bisphenol A; TDI; food contact materials; hazard; health risks; toxicity.
© 2023 European Food Safety Authority. EFSA Journal published by Wiley‐VCH GmbH on behalf of European Food Safety Authority.
Figures


The dashed black curves show the lower and upper envelope for the cpf resulting from the range of judgements between WG experts (lower and upper refer to relative position on the vertical axis). The red solid curves show the lower and upper bounds of the averaged cpf, where judgements of different experts for each cluster were aggregated by averaging. Blue dotted lines show probabilities for the estimated lowest BMD across all clusters being below the RP of 8.2 ng BPA/kg bw per day (HED). Green solid lines show probabilities for the estimated lowest BMD across all clusters being below the RP when an additional UF of 2 is applied, as discussed in Section 3.2.4. Subtracting these probabilities from 100% gives the corresponding probabilities for the estimated lowest BMD across all clusters being above the RP.


Each bar represents the range of % probability for the specified cluster and expert (expert A, B etc.).

Each graph shows the histogram provided by a single expert, and the parametric distribution that was subsequently fitted to their judgements.
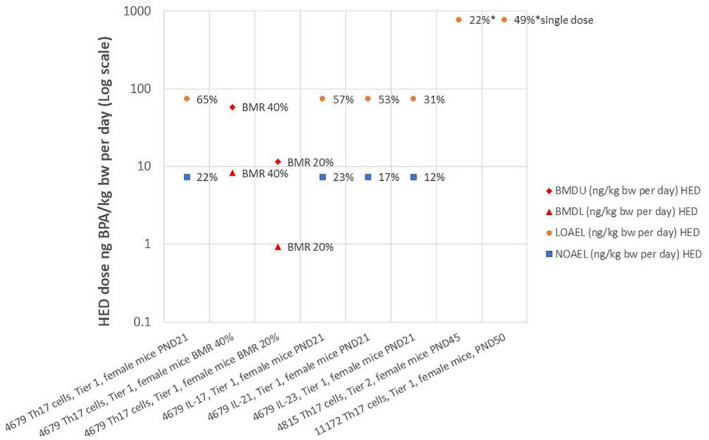
Labels on the horizontal axis comprise study reference identification (RefID) number, endpoint, tier of study (from WoE assessment), sex and species, and developmental stage or chosen BMR value. Percentages shown by BMDU and BMDL symbols refer to the BMR on which they are based; percentages shown by NOAEL and LOAEL symbols refer to the effect size at that dose as % change from the control group, estimated by EFSA from the original study.

Labels on the horizontal axis comprise study reference identification number (RefID), endpoint, tier of study (from WoE assessment), sex and species. Percentages shown by BMDU and BMDL symbols refer to the BMR on which they are based; percentages shown by NOAEL and LOAEL symbols refer to the effect size at that dose as % change from the control group, estimated by EFSA from the original study (na = not available).


Note: The odd‐looking distribution with a sharp peak near the centre of the graph is mixture of two normal distributions which provided the best fit to the judgements of this expert (expert C), shown in Annex K. Sensitivity analysis showed that using these fitted distributions or the histograms provided by the experts made no material difference to the results (see later).

Each bar represents the 90% probability interval of the distribution for the specified cluster and expert (expert A, B etc.).


The black curves in the graphs show the lower and upper bounds of the enveloped cpf for the estimated lowest BMD across all clusters for endpoints that occur in animals and are relevant and adverse for humans, assuming that the experts’ judgements for different clusters are independent. The coloured curves show the lower and upper bounds of the enveloped cpfs for the individual clusters, from which the combined cpfs are calculated. The curves for each cluster are identified by the combination of line type (solid, dashed, etc.) and colour, as shown by the legend on the right.

The solid black curves show the lower and upper bounds for the overall enveloped cpf resulting from the range of judgements between WG experts (lower and upper refer to relative position on the vertical axis). The red dashed curves show the lower and upper bounds of the overall averaged cpf, where judgements of different experts for each cluster were aggregated by averaging.


Each bar shows the lower and upper bound for the fifth percentile when the indicated cluster was excluded. The bottom bar (‘all’) shows the result when no clusters were omitted.

Each bar shows the lower and upper bound for the fifth percentile when the indicated cluster was excluded. The bottom bar (‘all’) shows the result when no clusters were omitted.


The percentages shown in blue are probabilities for the estimated lowest BMD across the 21 primary clusters being below the RP derived from the lower and upper bounds of the overall enveloped cpf (probabilities 5% and 100%) and the lower and upper bounds of the overall averaged cpf (probabilities 56% and 72%).


References
-
- Abdel‐Rahman HG, Abdelrazek HMA, Zeidan DW, Mohamed RM and Abdelazim AM, 2018. Lycopene: hepatoprotective and antioxidant effects toward bisphenol A‐induced toxicity in female Wistar rats. Oxidative Medicine and Cellular Longevity, 2018, 5167524. 10.1155/2018/5167524 [RefID 11426, 199‐G]. - DOI - PMC - PubMed
-
- Adusumilli VS, Walker TL, Overall RW, Klatt GM, Zeidan SA, Zocher S, Kirova DG, Ntitsias K, Fischer TJ, Sykes AM, Reinhardt S, Dahl A, Mansfeld J, Rünker AE and Kempermann G, 2021. ROS Dynamics delineate functional states of hippocampal neural stem cells and link to their activity‐dependent exit from quiescence. Cell Stem Cell, 28, 300–314.e6. 10.1016/j.stem.2020.10.019 - DOI - PMC - PubMed
LinkOut - more resources
Full Text Sources