. 2021 Nov:52:177-197.
doi: 10.1146/annurev-ecolsys-010621-044528.

Effects of Selection at Linked Sites on Patterns of Genetic Variability

Affiliations

Effects of Selection at Linked Sites on Patterns of Genetic Variability

Brian Charlesworth et al. Annu Rev Ecol Evol Syst. 2021 Nov.

Abstract

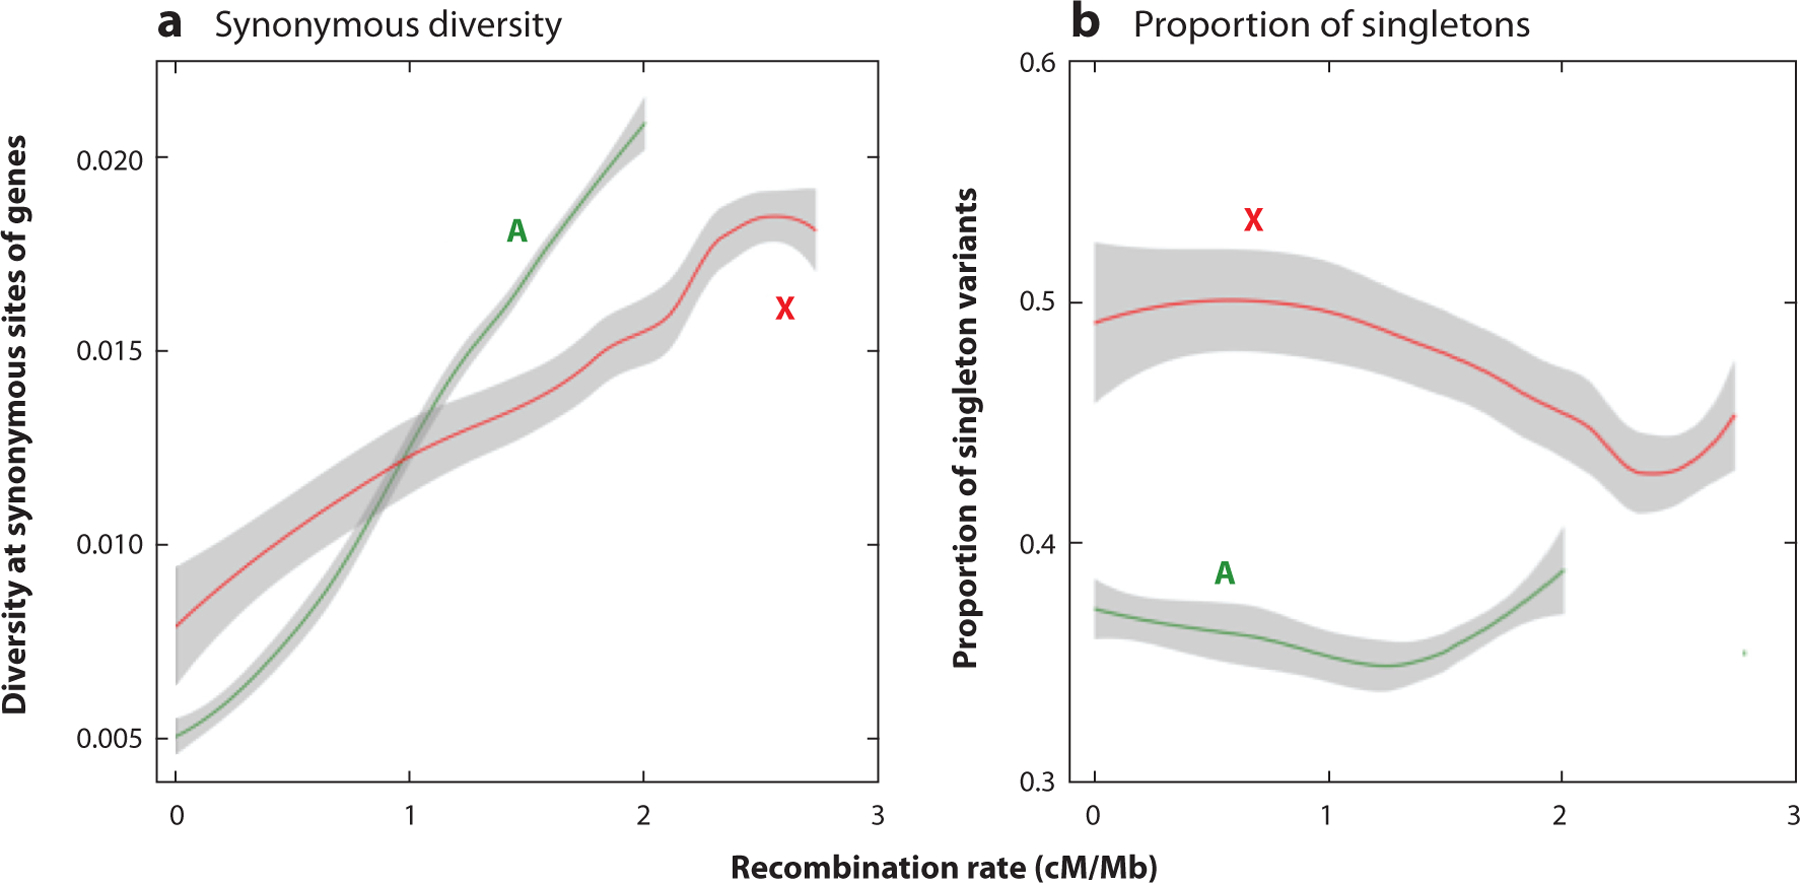
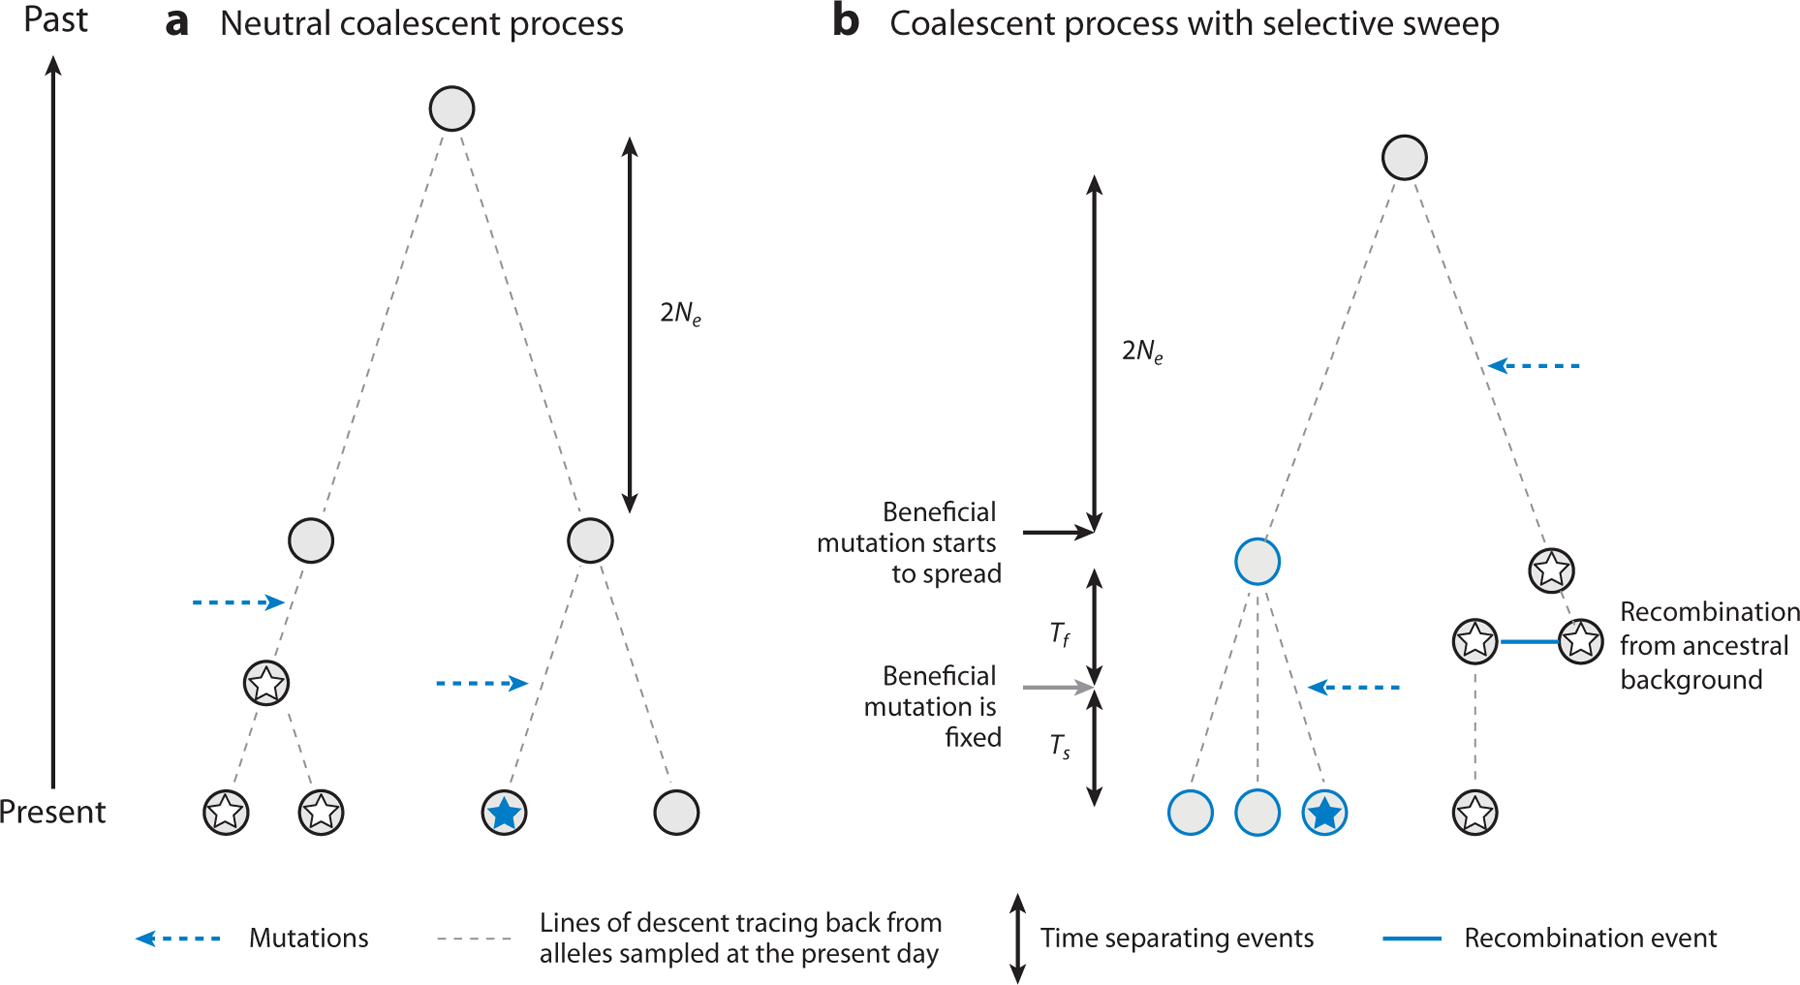
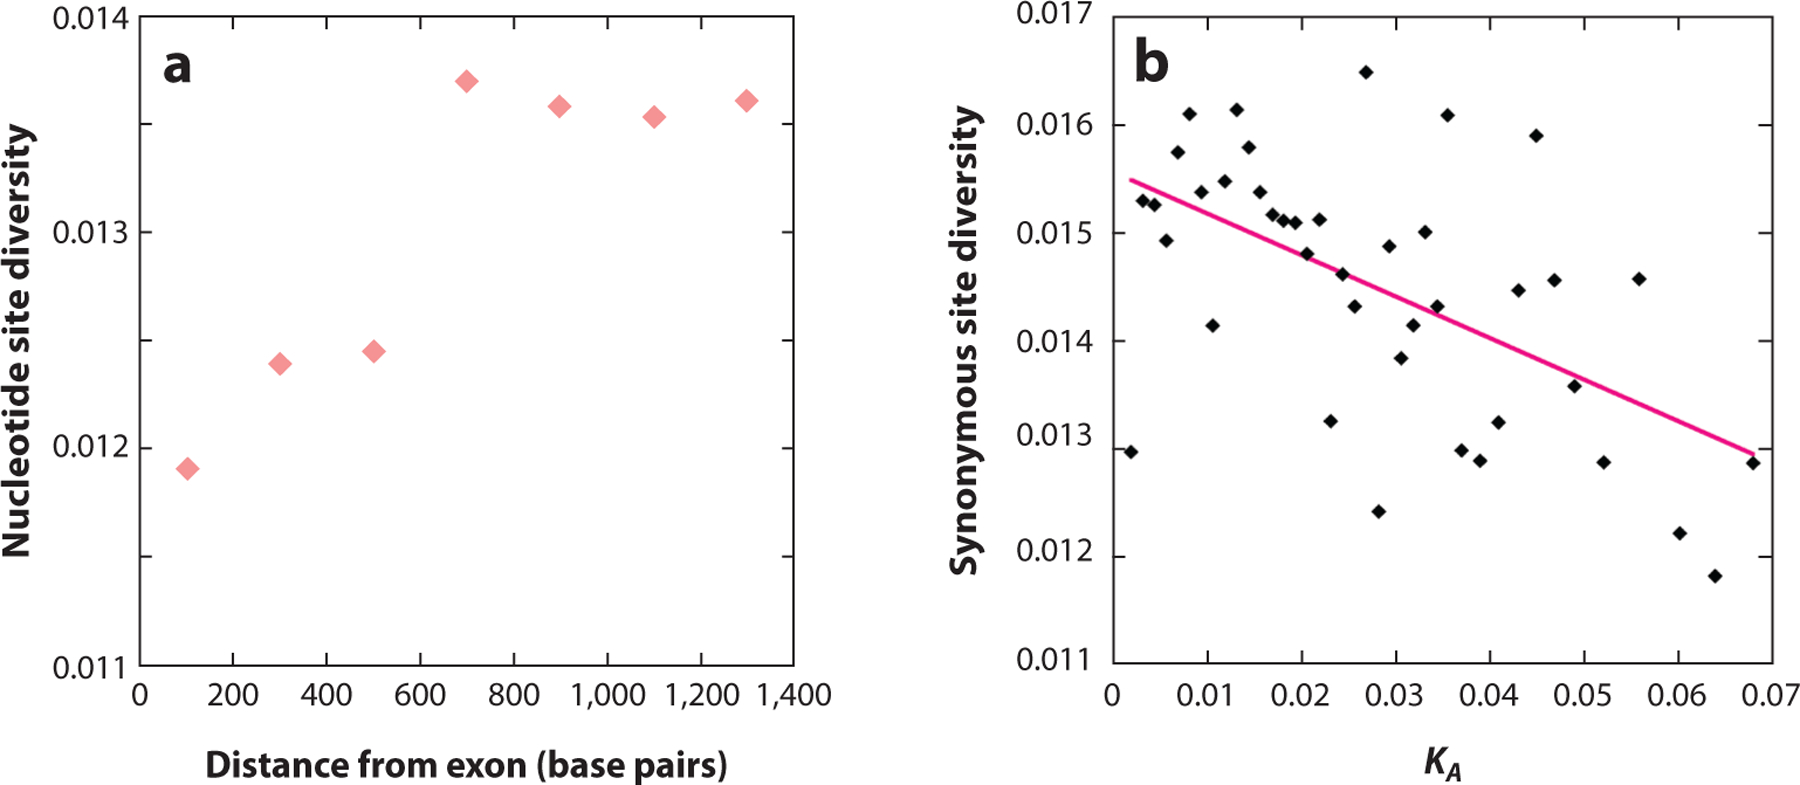
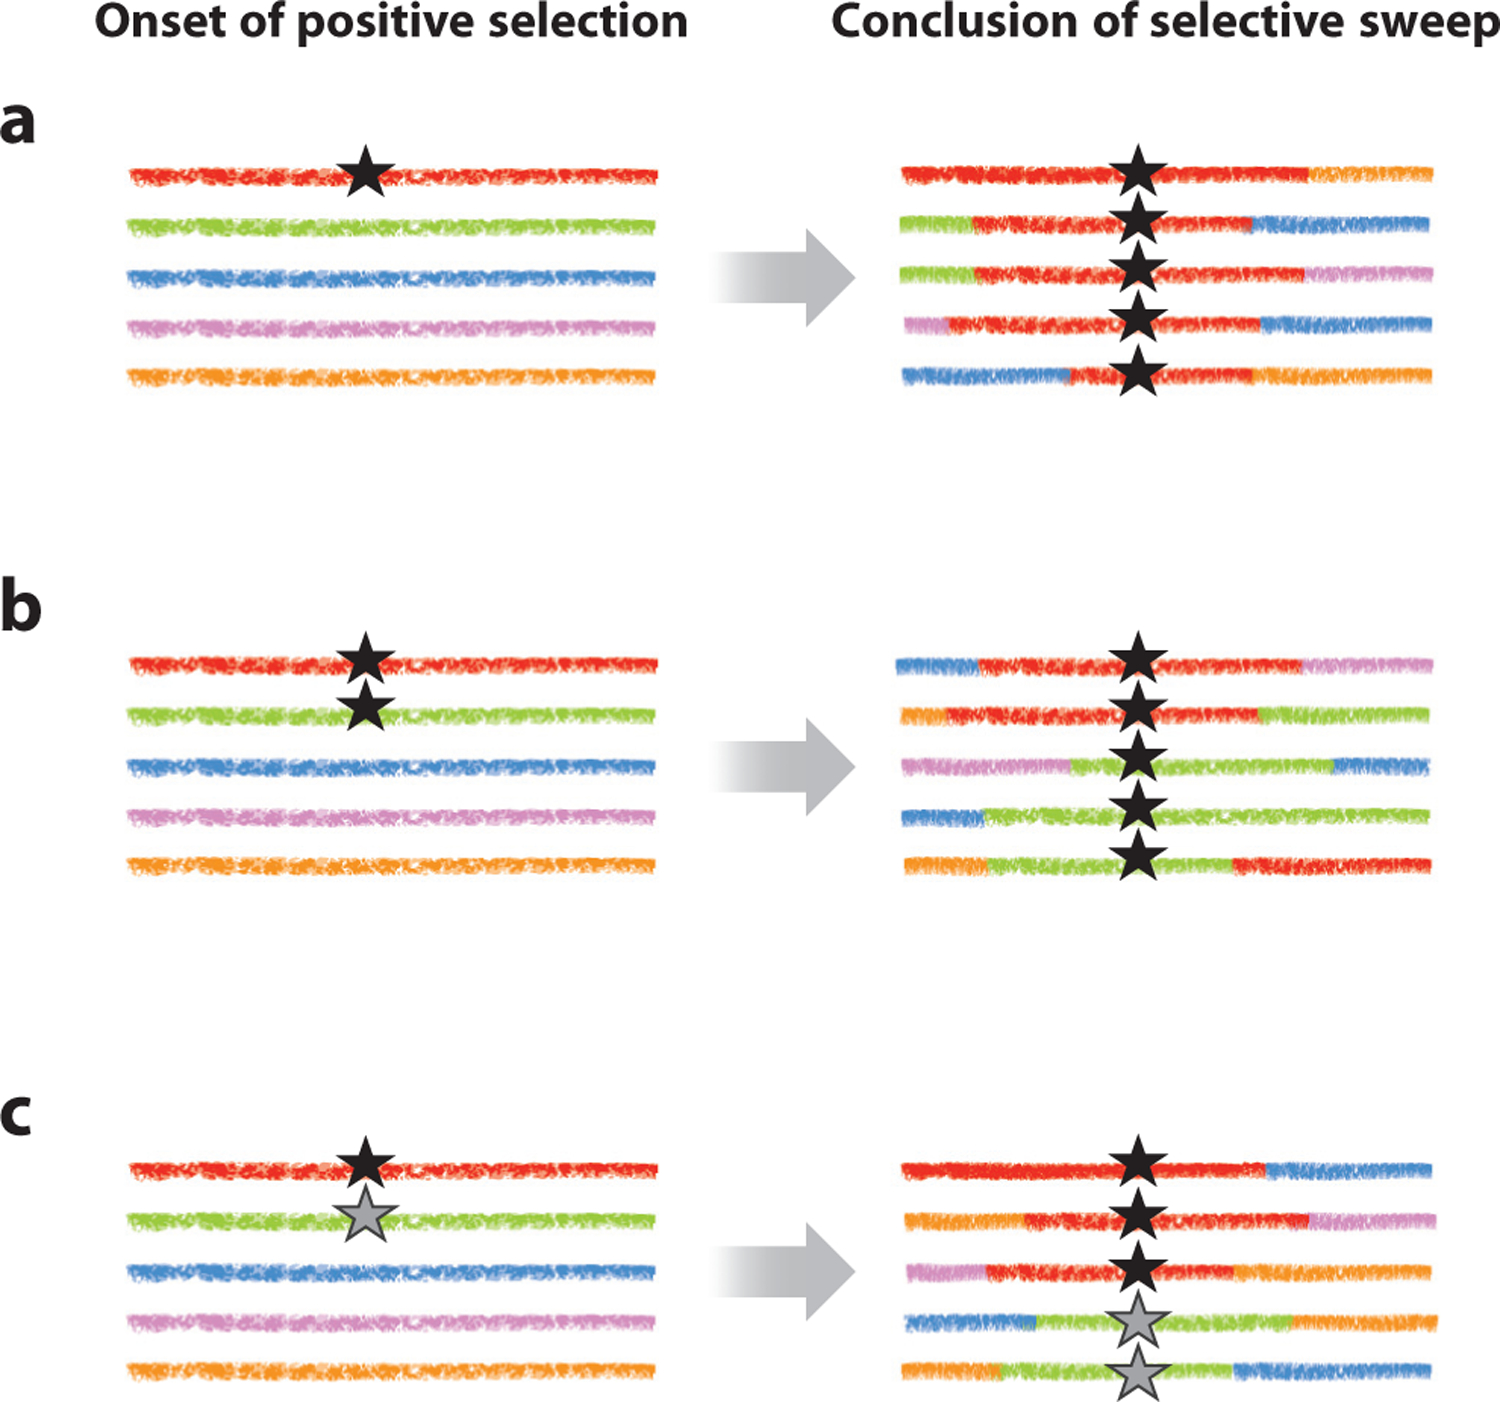
Patterns of variation and evolution at a given site in a genome can be strongly influenced by the effects of selection at genetically linked sites. In particular, the recombination rates of genomic regions correlate with their amount of within-population genetic variability, the degree to which the frequency distributions of DNA sequence variants differ from their neutral expectations, and the levels of adaptation of their functional components. We review the major population genetic processes that are thought to lead to these patterns, focusing on their effects on patterns of variability: selective sweeps, background selection, associative overdominance, and Hill-Robertson interference among deleterious mutations. We emphasize the difficulties in distinguishing among the footprints of these processes and disentangling them from the effects of purely demographic factors such as population size changes. We also discuss how interactions between selective and demographic processes can significantly affect patterns of variability within genomes.

Keywords: Hill–Robertson interference; associative overdominance; background selection; genetic recombination; hitchhiking; selective sweeps.


Figures

Figure 1
Figure 1
(a) The y-axis shows the pairwise diversity per nucleotide site at synonymous sites of genes in a sample of 17 haploid genomes of Drosophila melanogaster from a Rwandan population (Campos et al. 2014). (b) The y-axis shows the proportion of singleton variants (those present as a single copy in the sample). The x-axis of panels a and b displays the estimated rate of crossing over per megabase for each gene, corrected for the absence of crossing over in males. The plots are Loess regression fits with 95% confidence intervals (gray shading). The green curves are for autosomal genes (A), and the red curves are for X-linked genes (X). Panel a shows that diversity increases with the rate of crossing over experienced by a gene, whereas panel b shows that the proportion of singletons has a complex relationship with the rate of crossing over, although on autosomes it tends to decline with the rate of crossing over in the lower part of the range of crossing over rates. The difference between the proportions of singletons on the X chromosome and autosomes is striking and is suggestive of stronger hitchhiking effects on the X chromosome (Campos et al. 2014).
Figure 2
Figure 2
(a) Neutral coalescence and (b) coalescence with a selective sweep. The dashed black lines represent lines of descent tracing back from alleles sampled at the present day (bottom, gray circles). The coalescence of two alleles into an ancestral allele from which they are descended is indicated by the merger of the pair of lines connecting them to the ancestor. The horizontal dashed blue arrows represent occurrences of mutations at different sites in the sequence. (a) The neutral coalescent process for a sample of four alleles. The first mutation (white star) occurred after the first coalescent event (looking back in time), such that its frequency is 1/2; the second mutation (blue star) occurred before the first coalescent event on its branch of the tree, such that its frequency is 1/4. The double-headed arrow to the right of the tree indicates the expected time to the last coalescent event (2Ne generations). (b) Coalescence for a neutral locus linked to a site that has experienced a selective sweep, which finished Ts generations ago. The blue outlines indicate alleles carrying the beneficial mutation, all of which coalesced at the start of the sweep and whose duration is Tf generations. The solid black and gray arrows indicate the times of spread and fixation of this mutation, respectively. The solid blue line indicates a recombination event, such that the neutral site in question traced its ancestry to a wild-type background at the selected locus; its expected time to coalescence with the ancestor of all the nonrecombinant alleles counting back from the start of the sweep is 2Ne generations. The white stars indicate a mutation that arose in an ancestor of the recombinant allele; the blue star indicates a mutation that arose at a different site in an ancestor of a nonrecombinant allele. Both mutations have a frequency of 1/4 in the sample.
Figure 3
Figure 3
(a) The y-axis is the mean nucleotide site diversity in 200-bp sliding windows of intergenic sequence, and the x-axis is the distance of the middle of each window from the 5’ end of the exon. The data are for 94 single-exon genes sequenced in 76 haploid genomes from Drosophila melanogaster individuals sampled in Zambia; noncoding sites under strong selective constraints have been masked ( Johri et al. 2020). The Pearson correlation coefficient is r = 0.88, p < 0.01. (b) The points represent the mean synonymous site diversities of sets of autosomal genes from the Rwandan population of D. melanogaster used in Figure 1, grouped into 40 bins with respect to their divergence at nonsynonymous sites from the related species D. yakuba (KA). The solid pink line is the least-squares linear regression of diversity on KA (y = 0.0156 – 0.0385x, r =− 0.563, p < 0.001).
Figure 4
Figure 4
Diagram of three model realizations at two timepoints for five chromosomes sampled from a population subject to a selective sweep. Each colored line represents a unique chromosome-wide haplotype segregating in the population at the onset of selection, carrying a unique combination of polymorphic variants. The black and gray stars indicate distinct new mutations that are subject to positive selection. The left-hand column represents the state of the population at the onset of a selective sweep, and the right-hand column represents the state at the end of the sweep, when all individuals carry a beneficial variant. All models are characterized by hitchhiking effects due to associations with the beneficial mutation, as well as by breaks in these associations at various distances from the selected site caused by recombination events. (a) Hard sweep, i.e., selection on a rare variant. This is characterized by fixation of a single haplotype close to the target of selection (red haplotype). (b) Soft sweep in which selection acts on a common variant that was formerly neutral or deleterious. (c) Soft sweep in which selection acts on two independently occurring, beneficial variants with the same selection coefficient (black and gray stars). Both soft selective sweep models are characterized by multiple haplotypes segregating immediately around the target of selection (the red and green haplotypes, on which the beneficial variant was previously segregating neutrally or on which two beneficial variants arose independently).

References

    1. Bank C, Foll M, Ferrer-Admetlla A, Ewing G, Jensen JD. 2014. Thinking too positive? Revisiting current methods in population genetic selection inference. Trends Genet 30:540–46 - PubMed
    1. Barton NH. 1979. Gene flow past a cline. Heredity 43:333–39
    1. Barton NH. 2000. Genetic hitchhiking. Philos. Trans. R. Soc. B 355:1553–62 - PMC - PubMed
    1. Bast J, Parker DJ, Dumas Z, Jalvingh KM, Van PT, et al. 2018. Consequences of asexuality in natural populations: insights from stick insects. Mol. Biol. Evol 35:1668–77 - PMC - PubMed
    1. Becher H, Jackson BC, Charlesworth B. 2020. Patterns of genetic variability in genomic regions with low rates of recombination. Curr. Biol 30:94–100 - PubMed

LinkOut - more resources