. 2023 Apr 5:14:1157371.
doi: 10.3389/fphys.2023.1157371. eCollection 2023.

Towards continuous EIT monitoring for hemorrhagic stroke patients

Affiliations

Towards continuous EIT monitoring for hemorrhagic stroke patients

Taweechai Ouypornkochagorn et al. Front Physiol. .

Abstract

The practical implementation of continuous monitoring of stroke patients by Electrical Impedance Tomography (EIT) is addressed. In a previous paper, we have demonstrated EIT sensitivity to cerebral hemodynamics, using scalp-mounted electrodes, very low-noise measurements, and a novel image reconstruction method. In the present paper, we investigate the potential to adapt that system for clinical application, by using 50% fewer electrodes and by incorporating into the measurement protocol an additional high-frequency measurement to provide an effective reference. Previously published image reconstruction methods for multi-frequency EIT are substantially improved by exploiting the forward calculations enabled by the detailed head model, particularly to make the referencing method more robust and to attempt to remove the effects of modelling error. Images are presented from simulation of a typical hemorrhagic stroke and its growth. These results are encouraging for exploration of the potential clinical benefit of the methodology in long-term monitoring of hemorrhagic stroke.

Keywords: electrical impedance tomography; image reconstruction; low-noise; multi-frequency; simulation; stroke.


Conflict of interest statement

The authors declare that the research was conducted in the absence of any commercial or financial relationships that could be construed as a potential conflict of interest.

Figures

FIGURE 1
FIGURE 1
(A) The 16-electrode array; (B) Top view of the 2-D projection of the simulated 40 mm-diameter spherical blood inclusions, defining the inclusion sites FRONT, LEFT and RIGHT, as used in the text and in Figure 3; Figure 4; and (C) Side view of the head, showing the location of the 2-D plane (dashed line) that contains the centre point of the FRONT inclusion; the centre points of the LEFT and RIGHT inclusions lie in a parallel plane that is 10 mm higher in the head.
FIGURE 2
FIGURE 2
The electrode numbering scheme, (A) showing only the plane of 10 and the applied Current Patterns (CPs) involving electrodes only within that plane, and (B) including both the plane of 6 and the plane of 10, and showing also the CPs that involve any electrode within the plane of 6.
FIGURE 3
FIGURE 3
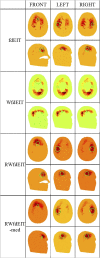
Noise-free case: reconstructed images of conductivity change due to the inclusions shown in Figure 1B, for each reconstruction method (as given in the leftmost column), sectioned at the CoG (axial and sagittal views). Green circles show the location of the true simulated inclusion within the CoG section, and black circles show the location of the reconstructed object (with diameter equal to that of the true sphere section).
FIGURE 4
FIGURE 4
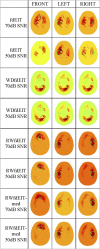
Noise cases 70 dB and 50 dB SNR: reconstructed images of conductivity change due to the inclusions shown in Figure 1B, for each reconstruction method (as given in the leftmost column, with the SNR value), sectioned at the CoG (axial view). Green and black circles are as described in Figure 3.
FIGURE 5
FIGURE 5
Reconstructed images of conductivity change due to an inclusion growing from 20 mm- to 60 mm-diameter at the LEFT site shown in Figure 1B, for the 70 dB SNR noise case, sectioned at the CoG (axial view). The reconstruction method is given at the top of each column of images. Green and black circles are as described in Figure 3.
FIGURE 6
FIGURE 6
Localization error (noise-free case) for blood inclusion size varying from 20 mm- to 60 mm-diameter.

Similar articles

Cited by

  • Clinical electromagnetic brain scanner.
    Abbosh A, Bialkowski K, Guo L, Al-Saffar A, Zamani A, Trakic A, Brankovic A, Bialkowski A, Zhu G, Cook D, Crozier S. Abbosh A, et al. Sci Rep. 2024 Mar 8;14(1):5760. doi: 10.1038/s41598-024-55360-7. Sci Rep. 2024. PMID: 38459073 Free PMC article.

References

    1. Adler A., Boyle A. (2017). Electrical impedance tomography: Tissue properties to image measures. IEEE Trans. Biomed. Eng. 64, 2494–2504. 10.1109/TBME.2017.2728323 - DOI - PubMed
    1. Adler A., Gaggero P. O., Maimaitijiang Y. (2011). Adjacent stimulation and measurement patterns considered harmful. Physiol. Meas. 32, 731–744. 10.1088/0967-3334/32/7/S01 - DOI - PubMed
    1. Anas M., Norali A., Rehman M. (2012). Development of a low cost precision blood resistivity measurement device based on Thompson Lampard theorem. Penang, Malaysia: IEEE, 594–597.
    1. Brown B. H. (2003). Electrical impedance tomography (EIT): A review. J. Med. Eng. Technol. 27 (3), 97–108. 10.1080/0309190021000059687 - DOI - PubMed
    1. Donnan G. A., Fisher M., MacLeod M., Davis S. M. (2008). Stroke. Lancet 371, 1612–1623. 10.1016/S0140-6736(08)60694-7 - DOI - PubMed

LinkOut - more resources