

Characteristics and drivers of plant C, N, and P stoichiometry in Northern Tibetan Plateau grassland
- PMID: 37089650
- PMCID: PMC10118023
- DOI: 10.3389/fpls.2023.1092872
Characteristics and drivers of plant C, N, and P stoichiometry in Northern Tibetan Plateau grassland
Abstract
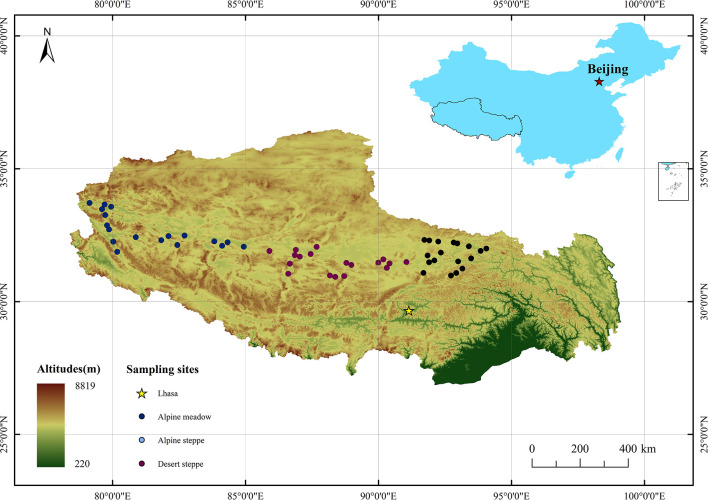
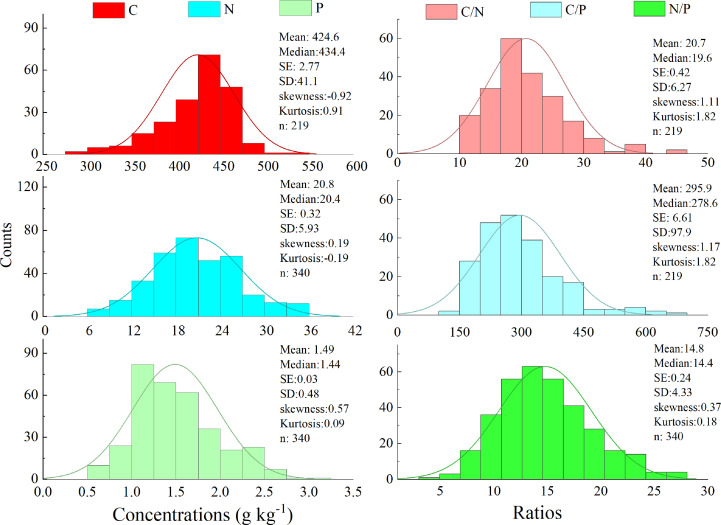
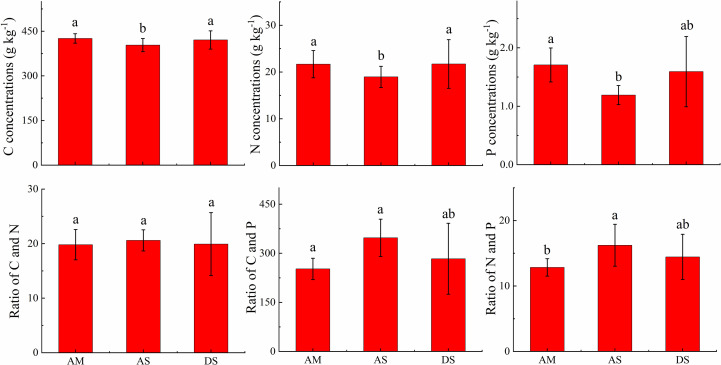
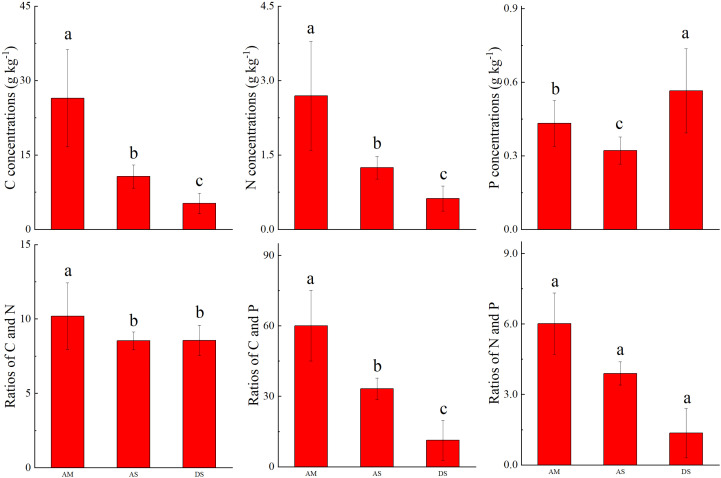
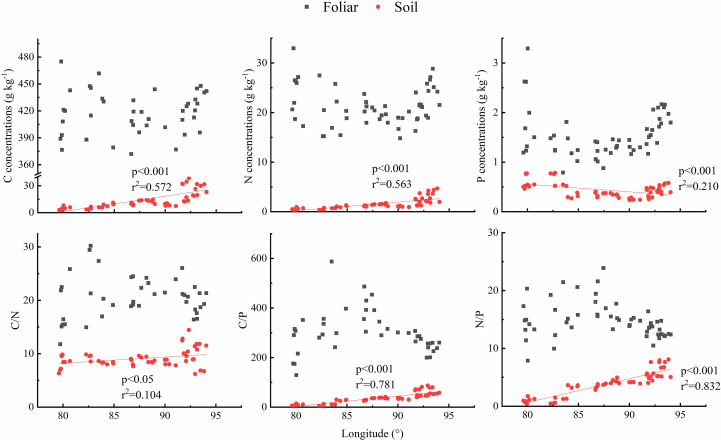
Understanding vegetation C, N, and P stoichiometry helps us not only to evaluate biogeochemical cycles and ecosystem functions but also to predict the potential impact of environmental change on ecosystem processes. The foliar C, N, and P stoichiometry in Northern Tibetan grasslands, especially the controlling factors, has been highlighted in recent years. In this study, we have collected 340 plant samples and 162 soil samples from 54 plots in three grassland types, with the purpose of evaluating the foliar C, N, and P stoichiometry and underlying control factors in three grassland types along a 1,500-km east-to-west transect in the Northern Tibetan Plateau. Our results indicated that the averaged foliar C, N, and P concentrations were 425.9 ± 15.8, 403.4 ± 22.2, and 420.7 ± 30.7 g kg-1; 21.7 ± 2.9, 19.0 ± 2.3, and 21.7 ± 5.2 g kg-1; and 1.71 ± 0.29, 1.19 ± 0.16, and 1.59 ± 0.6 g kg-1 in the alpine meadow (AM), alpine steppe (AS), and desert steppe (DS) ecosystems, respectively. The foliar C and N ratios were comparable, with values of 19.8 ± 2.8, 20.6 ± 1.9, and 19.9 ± 5.8 in the AM, AS, and DS ecosystems, respectively. Both the C/P and N/P ratios are the lowest in the AM ecosystem, with values of 252.2 ± 32.6 and 12.8 ± 1.3, respectively, whereas the highest values of 347.3 ± 57.0 and 16.2 ± 3.2 were obtained in the AS ecosystem. In contrast, the soil C, N, C/P, and N/P values decreased from the AM to DS ecosystem. Across the whole transects, leaf C, N, and P stoichiometry showed no obvious trend, but soil C and N concentrations showed an increasing trend, and soil P concentrations showed a decreasing trend with the increasing longitude. Based on the general linear model analysis, the vegetation type was the dominant factor controlling the leaf C, N, and P stoichiometry, accounting for 42.8% for leaf C, 45.1% for leaf N, 35.2% for leaf P, 52.9% for leaf C/N, 39.6% for leaf C/P, and 48.0% for leaf N/P; the soil nutrients and climate have relatively low importance. In conclusion, our results supported that vegetation type, rather than climatic variation and soil nutrients, are the major determinants of north Tibet grassland leaf stoichiometry.
Keywords: C; N; North Tibetan Plateau; and P stoichiometry; grassland type; influence factors; plant and soil.
Copyright © 2023 Wang, Zhao, Xing and Wang.
Conflict of interest statement
The authors declare that the research was conducted in the absence of any commercial or financial relationships that could be construed as a potential conflict of interest.
Figures
Similar articles
-
Soil moisture and texture primarily control the soil nutrient stoichiometry across the Tibetan grassland.Sci Total Environ. 2018 May 1;622-623:192-202. doi: 10.1016/j.scitotenv.2017.11.331. Epub 2017 Dec 13. Sci Total Environ. 2018. PMID: 29216462
-
Variation of plant CSR strategies across a precipitation gradient in the alpine grasslands on the northern Tibet Plateau.Sci Total Environ. 2022 Sep 10;838(Pt 3):156512. doi: 10.1016/j.scitotenv.2022.156512. Epub 2022 Jun 6. Sci Total Environ. 2022. PMID: 35679928
-
Biomass, Carbon and Nitrogen Partitioning and Water Use Efficiency Differences of Five Types of Alpine Grasslands in the Northern Tibetan Plateau.Int J Environ Res Public Health. 2022 Oct 11;19(20):13026. doi: 10.3390/ijerph192013026. Int J Environ Res Public Health. 2022. PMID: 36293622 Free PMC article.
-
Leaf carbon, nitrogen, and phosphorus ecological stoichiometry of grassland ecosystems along 2,600-m altitude gradients at the Northern slope of the Tianshan Mountains.Front Plant Sci. 2024 Jul 29;15:1430877. doi: 10.3389/fpls.2024.1430877. eCollection 2024. Front Plant Sci. 2024. PMID: 39135646 Free PMC article.
-
[Vegetation and soil characteristics of degraded alpine meadows on the Qinghai-Tibet Pla-teau, China: A review].Ying Yong Sheng Tai Xue Bao. 2020 Jun;31(6):2109-2118. doi: 10.13287/j.1001-9332.202006.002. Ying Yong Sheng Tai Xue Bao. 2020. PMID: 34494765 Review. Chinese.
References
-
- Aerts R., Chapin F. S. (1999). The mineral nutrition of wild plants revisited: A re-evaluation of processes and patterns. Adv. Ecol. Res. 30, 1–67. doi: 10.1016/s0065-2504(08)60016-1 - DOI
-
- Bao S. D. (2000). Soil agro-chemistrical analysis. 3rd ed. (China Agriculture Science and Technique Press; ).
-
- Bertiller M. B., Sain C. L., Carrera A. L., Vargas D. N. (2005). Patterns of nitrogen and phosphorus conservation in dominant perennial grasses and shrubs across an aridity gradient in Patagonia, Argentina. J. Arid. Environ. 62, 209–223. doi: 10.1016/j.jaridenv.2004.11.011 - DOI
-
- Cai Q., Ding J. X., Zhang Z. L., Hu J., Wang Q. T., Yin M. Z., et al. . (2019). Distribution patterns and driving factors of leaf c, n and p stoichiometry of coniferous species on the eastern qinghai-xizang plateau, China. Chin. J. Plant Ecol. 43, 1048–1060. doi: 10.17521/cjpe.2019.0221 - DOI
LinkOut - more resources
Full Text Sources
Research Materials
Miscellaneous