. 2023 Apr 5:14:1153731.
doi: 10.3389/fpls.2023.1153731. eCollection 2023.

Hyperpolarization electrical signals induced by local action of moderate heating influence photosynthetic light reactions in wheat plants

Affiliations

Hyperpolarization electrical signals induced by local action of moderate heating influence photosynthetic light reactions in wheat plants

Lyubov Yudina et al. Front Plant Sci. .

Abstract

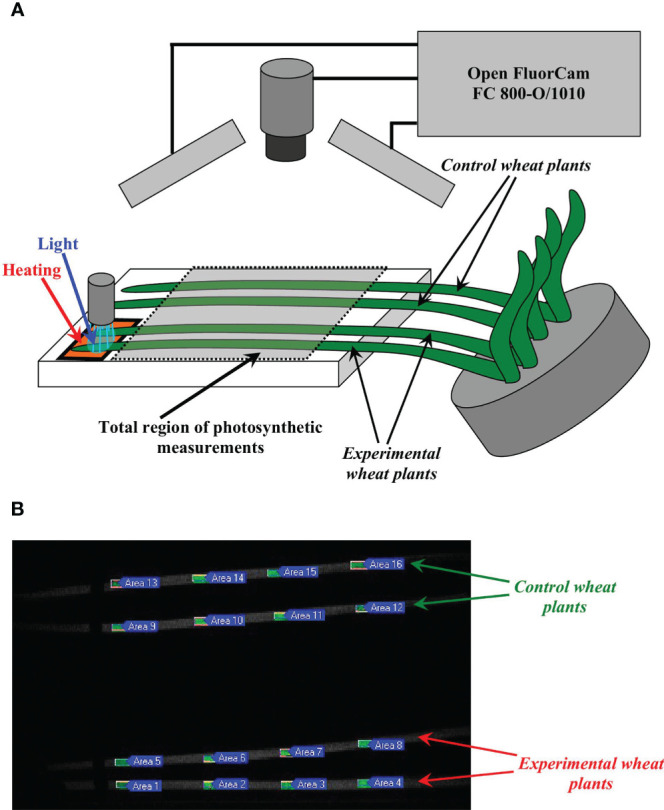
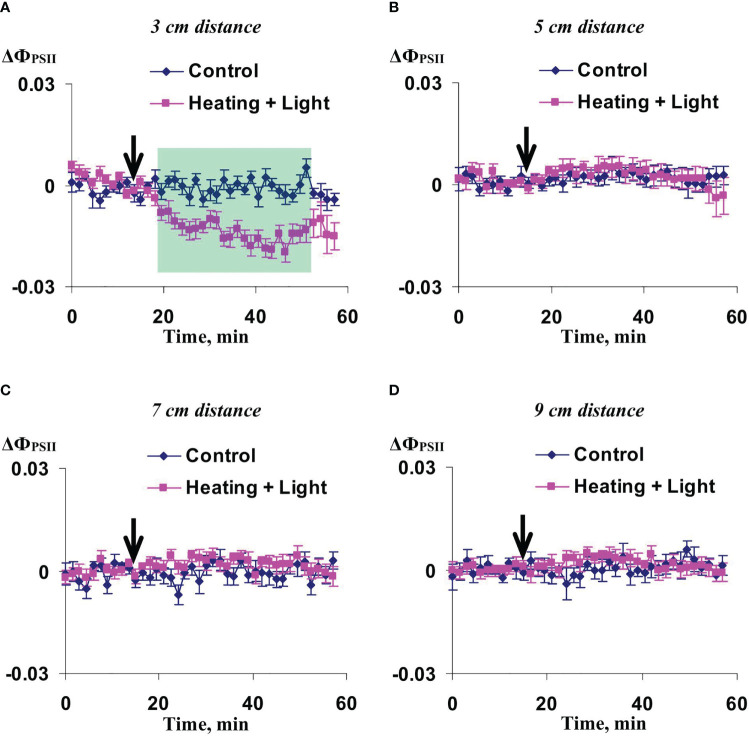
Local action of stressors induces fast changes in physiological processes in intact parts of plants including photosynthetic inactivation. This response is mediated by generation and propagation of depolarization electrical signals (action potentials and variation potentials) and participates in increasing plant tolerance to action of adverse factors. Earlier, we showed that a local action of physiological stimuli (moderate heating and blue light), which can be observed under environmental conditions, induces hyperpolarization electrical signals (system potentials) in wheat plants. It potentially means that these signals can play a key role in induction of fast physiological changes under the local action of environmental stressors. The current work was devoted to investigation of influence of hyperpolarization electrical signals induced by the local action of the moderate heating and blue light on parameters of photosynthetic light reactions. A quantum yield of photosystem II (ФPSII) and a non-photochemical quenching of chlorophyll fluorescence (NPQ) in wheat plants were investigated. It was shown that combination of the moderate heating (40°C) and blue light (540 µmol m-2s-1) decreased ФPSII and increased NPQ; these changes were observed in 3-5 cm from border of the irritated zone and dependent on intensity of actinic light. The moderate soil drought (7 days) increased magnitude of photosynthetic changes and shifted their localization which were observed on 5-7 cm from the irritated zone; in contrast, the strong soil drought (14 days) suppressed these changes. The local moderate heating decreased ФPSII and increased NPQ without action of the blue light; in contrast, the local blue light action without heating weakly influenced these parameters. It meant that just local heating was mechanism of induction of the photosynthetic changes. Finally, propagation of hyperpolarization electrical signals (system potentials) was necessary for decreasing ФPSII and increasing NPQ. Thus, our results show that hyperpolarization electrical signals induced by the local action of the moderate heating inactivates photosynthetic light reactions; this response is similar with photosynthetic changes induced by depolarization electrical signals. The soil drought and actinic light intensity can influence parameters of these photosynthetic changes.

Keywords: hyperpolarization electrical signals; light; local moderate heating; non-photochemical quenching; photosynthetic response; quantum yield of photosystem II; soil drought.


Conflict of interest statement

The authors declare that the research was conducted in the absence of any commercial or financial relationships that could be construed as a potential conflict of interest.

Figures

Figure 1
Figure 1
Scheme of experimental set providing to local action of heating and blue light on top of wheat plants and to photosynthetic measurements (A), and example of localizations of ROIs in experimental and control wheat plants (B). Local action of heating (40°C) and blue light (540 µmol m-2s-1) were described in detail in our previous work (Yudina et al., 2023); duration of illumination equaled to 10 min after initiation of irritation, and duration of heating equaled to about 45 min. PAM imaging Open FluorCam FC 800-O/1010 was used for measurements of quantum yield of photosystem II (ФPSII) and non-photochemical quenching of chlorophylls (NPQ). Photosynthetic measurements were initiated in 15 min before the irritation after 15-min dark adaptation and subsequent 30-min adaptation under standard white actinic light of this system (86, 456, or 838 µmol m-2s-1). Four wheat plants (two plants with irritations and two control plants) were simultaneously measured in each experiment. In each plant, ФPSII and NPQ were investigated in four ROIs with centers in 3, 5, 7, and 9 cm from the border of the irritated zone.
Figure 2
Figure 2
Averaged changes in the quantum yield of photosystem II (ΔФPSII) in 3 cm (A), 5 cm (B), 7 cm (C), and 9 cm (D) from zone of the local action of combination of heating and blue light in irrigated wheat plants (n=12). Arrow marks initiation of this action; control plants were not irritated. ΔФPSII was calculated as ФPSII - ФPSII 0, where ФPSII 0 was measured before the initiation of the irritation. Intensity of the white actinic light was 456 µmol m-2s-1. Green shading shows time interval with significant differences between experimental and control values (p<0.05, Student’s test).
Figure 3
Figure 3
Averaged changes in the non-photochemical quenching of chlorophyll (ΔNPQ) in 3 cm (A), 5 cm (B), 7 cm (C), and 9 cm (D) from zone of the local action of combination of heating and blue light in irrigated wheat plants (n=12). Arrow marks initiation of this action; control plants were not irritated. ΔNPQ was calculated as NPQ - NPQ0, where NPQ0 was measured before the initiation of the irritation. Intensity of the white actinic light was 456 µmol m-2s-1. Green shadings show time intervals with significant differences between experimental and control values (p<0.05, Student’s test).
Figure 4
Figure 4
Averaged changes in the quantum yield of photosystem II (ΔФPSII) and non-photochemical quenching of chlorophyll (ΔNPQ) in 3 cm from zone of the local action of combination of heating and blue light in wheat plants under 86 µmol m-2s-1 (A) and 838 µmol m-2s-1 (B) intensity of the white actinic light (n=8). Arrow marks initiation of this action; control plants were not irritated. Green shadings show time intervals with significant differences between experimental and control values (p<0.05, Student’s test).
Figure 5
Figure 5
Leaf temperatures (tleaf) under different intensities of the actinic light (n=16-24) (A) and averaged changes in the non-photochemical quenching of chlorophyll (ΔNPQ) in 3 cm from zone of the local action of combination of heating and blue light in wheat plants under the 26.3 ± 0.3°C leaf temperature and 456 µmol m-2s-1 actinic light intensity (n=4) (B), under the 29.7 ± 0.2°C leaf temperature and 456 µmol m-2s-1 actinic light intensity (n=4) (C), and under the 30.7 ± 0.8°C leaf temperature and 838 µmol m-2s-1 actinic light intensity (n=4) (D). Leaf temperatures were measured in 3 cm from the irritated zone before the local action of heating and blue light with using the Testo 885 thermal imager. Statistical analysis providing these ΔNPQ was described in the Section 3.1. Green shadings show time intervals with significant differences between experimental and control values (p<0.05, Student’s test). *, the leaf temperature was significantly differed from the temperature under 456 µmol m-2s-1 actinic light intensity.
Figure 6
Figure 6
Averaged changes in the quantum yield of photosystem II (ΔФPSII) in 3 cm (A), 5 cm (B), 7 cm (C), and 9 cm (D) from zone of the local action of combination of heating and blue light in wheat plants after 7-day soil drought (n=12). Arrow marks initiation of this action; control plants were not irritated. ΔФPSII was calculated as ФPSII - ФPSII 0, where ФPSII 0 was measured before the initiation of the irritation. Intensity of the white actinic light was 456 µmol m-2s-1. Green shadings show time intervals with significant differences between experimental and control values (p<0.05, Student’s test).
Figure 7
Figure 7
Averaged changes in the non-photochemical quenching of chlorophyll (ΔNPQ) in 3 cm (A), 5 cm (B), 7 cm (C), and 9 cm (D) from zone of the local action of combination of heating and blue light in wheat plants after 7-day soil drought (n=12). Arrow marks initiation of this action; control plants were not irritated. ΔNPQ was calculated as NPQ - NPQ0, where NPQ0 was measured before the initiation of the irritation. Intensity of the white actinic light was 456 µmol m-2s-1. Green shadings show time intervals with significant differences between experimental and control values (p<0.05, Student’s test).
Figure 8
Figure 8
Averaged changes in the quantum yield of photosystem II (ΔФPSII) in 3 cm (A), 5 cm (B), 7 cm (C), and 9 cm (D) from zone of the local action of combination of heating and blue light in wheat plants after 14-day soil drought (n=12). Arrow marks initiation of this action; control plants were not irritated. ΔФPSII was calculated as ФPSII - ФPSII 0, where ФPSII 0 was measured before the initiation of the irritation. Intensity of the white actinic light was 456 µmol m-2s-1.
Figure 9
Figure 9
Averaged changes in the non-photochemical quenching of chlorophyll (ΔNPQ) in 3 cm (A), 5 cm (B), 7 cm (C), and 9 cm (D) from zone of the local action of combination of heating and blue light in wheat plants after 14-day soil drought (n=12). Arrow marks initiation of this action; control plants were not irritated. ΔNPQ was calculated as NPQ - NPQ0, where NPQ0 was measured before the initiation of the irritation. Intensity of the white actinic light was 456 µmol m-2s-1. Green shading shows time interval with significant differences between experimental and control values (p<0.05, Student’s test).
Figure 10
Figure 10
Averaged changes in the quantum yield of photosystem II (ΔФPSII) in 3 cm (A), 5 cm (B), 7 cm (C), and 9 cm (D) from zone of the local action of blue light in irrigated wheat plants (n=8). Arrow marks initiation of this action; control plants were not irritated. ΔФPSII was calculated as ФPSII - ФPSII 0, where ФPSII 0 was measured before the initiation of the irritation. Intensity of the white actinic light was 456 µmol m-2s-1.
Figure 11
Figure 11
Averaged changes in the non-photochemical quenching of chlorophyll (ΔNPQ) in 3 cm (A), 5 cm (B), 7 cm (C), and 9 cm (D) from zone of the local action of blue light in irrigated wheat plants (n=8). Arrow marks initiation of this action; control plants were not irritated. ΔNPQ was calculated as NPQ - NPQ0, where NPQ0 was measured before the initiation of the irritation. Intensity of the white actinic light was 456 µmol m-2s-1. Green shading shows time interval with significant differences between experimental and control values (p<0.05, Student’s test).
Figure 12
Figure 12
Averaged changes in the quantum yield of photosystem II (ΔФPSII) in 3 cm (A), 5 cm (B), 7 cm (C), and 9 cm (D) from zone of the local action of heating in irrigated wheat plants (n=8). Arrow marks initiation of this action; control plants were not irritated. ΔФPSII was calculated as ФPSII - ФPSII 0, where ФPSII 0 was measured before the initiation of the irritation. Intensity of the white actinic light was 456 µmol m-2s-1. Green shading shows time interval with significant differences between experimental and control values (p<0.05, Student’s test).
Figure 13
Figure 13
Averaged changes in the non-photochemical quenching of chlorophyll (ΔNPQ) in 3 cm (A), 5 cm (B), 7 cm (C), and 9 cm (D) from zone of the local action of heating in irrigated wheat plants (n=8). Arrow marks initiation of this action; control plants were not irritated. ΔNPQ was calculated as NPQ - NPQ0, where NPQ0 was measured before the initiation of the irritation. Intensity of the white actinic light was 456 µmol m-2s-1. Green shadings show time intervals with significant differences between experimental and control values (p<0.05, Student’s test).
Figure 14
Figure 14
Records of hyperpolarization signals induced by different variants of local irritations (Heating+Light, Light, or Heating) under irrigation, 7-day, or 14-day soil drought (A) and average amplitudes of these signals (n=7-12) (B). Hyperpolarization signals in the 5 cm distance from the irritated zone were only measured and analyzed. Different letters mark significant differences (p<0.05, Student’s test).
Figure 15
Figure 15
A scheme of hypothetical ways of influence of hyperpolarization electrical signals (system potentials) on photosynthetic processes (see Discussion for details). The scheme is based on results of the current work and our previous results summarizing in reviews (Sukhov, 2016; Sukhov et al., 2019; Sukhova and Sukhov, 2021).

References

    1. Białasek M., Górecka M., Mittler R., Karpiński S. (2017). Evidence for the involvement of electrical, calcium and ROS signaling in the systemic regulation of non-photochemical quenching and photosynthesis. Plant Cell Physiol. 58, 207–215. doi: 10.1093/pcp/pcw232 - DOI - PMC - PubMed
    1. Bulychev A. A., Alova A. V. (2022). Microfluidic interactions involved in chloroplast responses to plasma membrane excitation in Chara . Plant Physiol. Biochem. 183, 111–119. doi: 10.1016/j.plaphy.2022.05.005 - DOI - PubMed
    1. Chatterjee S. K., Das S., Maharatna K., Masi E., Santopolo L., Mancuso S., et al. . (2015). Exploring strategies for classification of external stimuli using statistical features of the plant electrical response. J. R. Soc Interface. 12, 20141225. doi: 10.1098/rsif.2014.1225 - DOI - PMC - PubMed
    1. Chatterjee S. K., Malik O., Gupta S. (2018). Chemical sensing employing plant electrical signal response-classification of stimuli using curve fitting coefficients as features. Biosensors. 8, 83. doi: 10.3390/bios8030083 - DOI - PMC - PubMed
    1. Choi W. G., Hilleary R., Swanson S. J., Kim S. H., Gilroy S. (2016). Rapid, long-distance electrical and calcium signaling in plants. Annu. Rev. Plant Biol. 67, 287–307. doi: 10.1146/annurev-arplant-043015-112130 - DOI - PubMed

LinkOut - more resources