

Phosphorus Inventory for the Conterminous United States (2002-2012)
- PMID: 37089664
- PMCID: PMC10116864
- DOI: 10.1029/2020jg005684
Phosphorus Inventory for the Conterminous United States (2002-2012)
Abstract
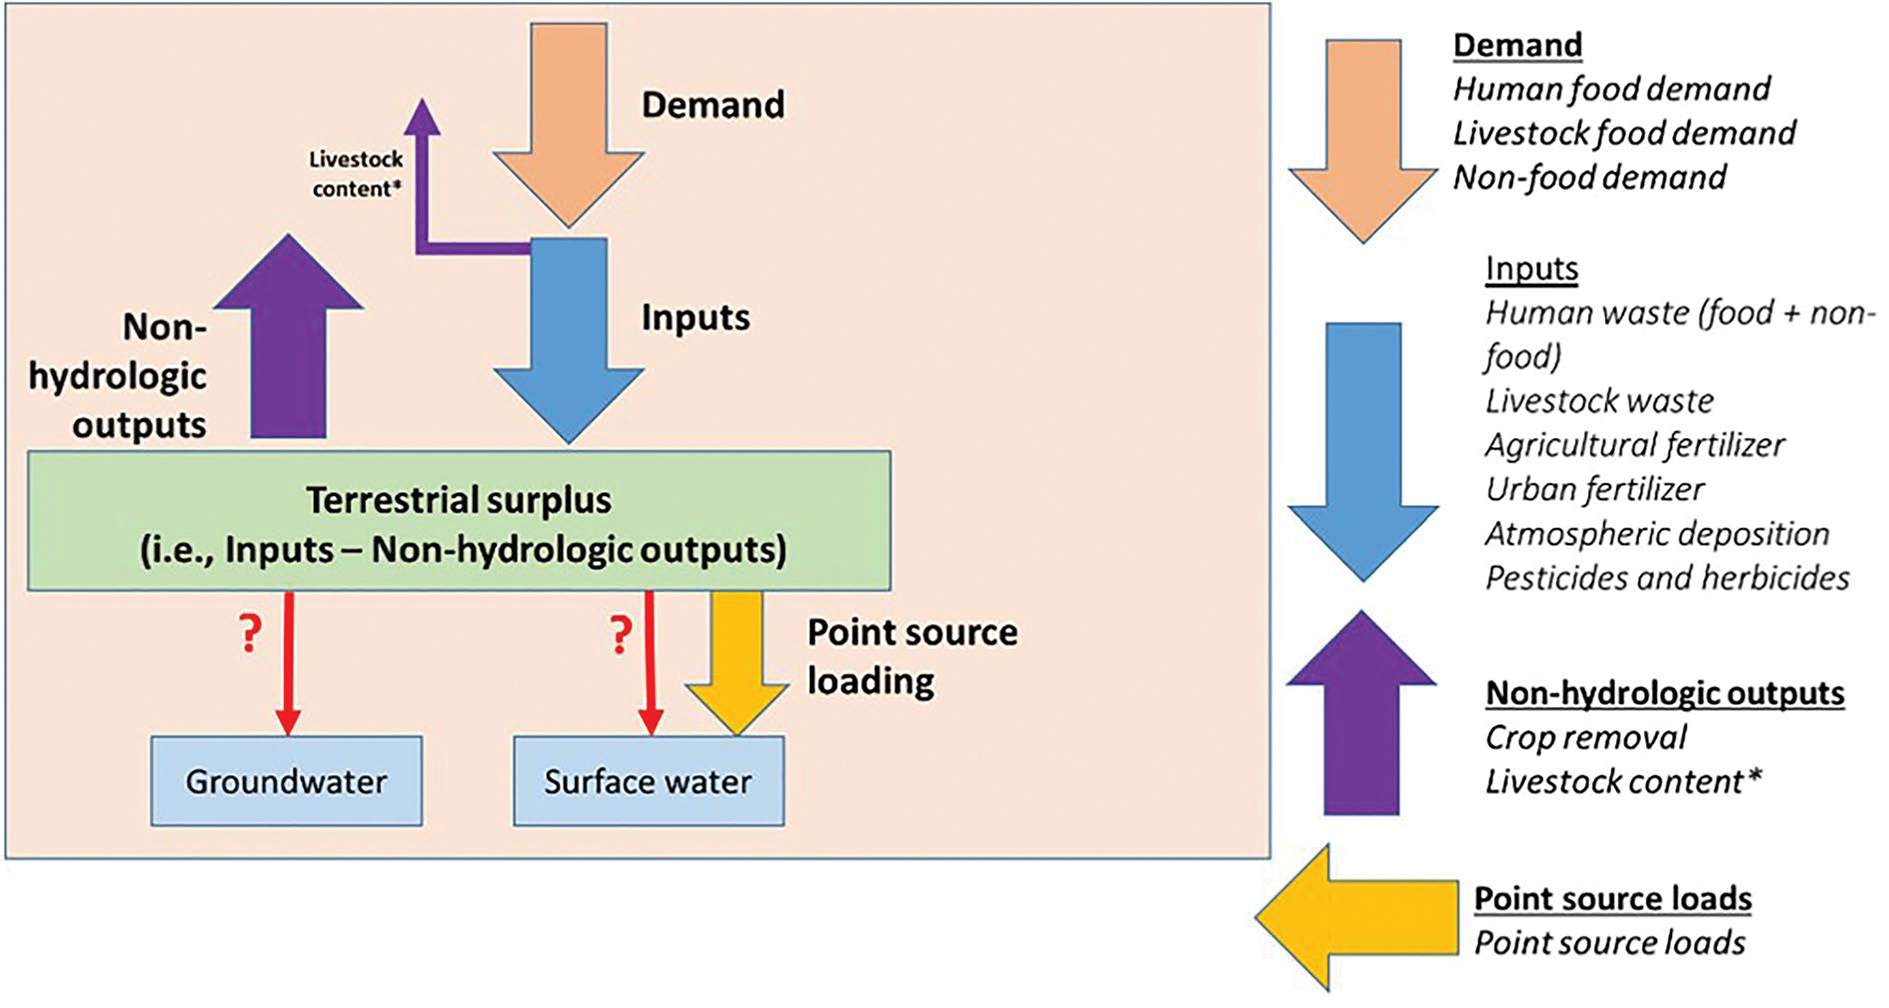
Published reports suggest efforts designed to prevent the occurrence of harmful algal blooms and hypoxia by reducing non-point and point source phosphorus (P) pollution are not delivering water quality improvements in many areas. Part of the uncertainty in evaluating watershed responses to management practices is the lack of standardized estimates of phosphorus inputs and outputs. To assess P trends across the conterminous United States, we compiled an inventory using publicly available datasets of agricultural P fluxes, atmospheric P deposition, human P demand and waste, and point source discharges for 2002, 2007, and 2012 at the scale of the 8-digit Hydrologic Unit Code subbasin (~1,800 km2). Estimates of agricultural legacy P surplus accumulated from 1945 to 2001 were also developed. Fertilizer and manure inputs were found to exceed crop removal rates by up to 50% in many agricultural regions. This excess in inputs has led to the continued accumulation of legacy P in agricultural lands. Atmospheric P deposition increased throughout the Rockies, potentially contributing to reported increases in surface water P concentrations in undisturbed watersheds. In some urban areas, P fluxes associated with human waste and non-farm fertilizer use has declined despite population growth, likely due, in part, to various sales bans on P-containing detergents and fertilizers. Although regions and individual subbasins have different contemporary and legacy P sources, a standardized method of accounting for large and small fluxes and ready to use inventory numbers provide essential infromation to coordinate targeted interventions to reduce P concentrations in the nation's waters.
Figures


References
-
- Alexander RB, & Smith RA (1990). County-level estimates of nitrogen and phosphorus fertilizer use in the United States, 1945 to 1985. Citeseer.
-
- Amos HM, Miniat CF, Lynch J, Compton J, Templer PH, Sprague LA, et al. (2018). What goes up must come down: Integrating air and water quality monitoring for nutrients. ACS Publications. - PubMed
-
- Baker NT, & Stone WW (2014). Estimated annual agricultural pesticide use for counties of the conterminous United States, 2008–12. US Department of the Interior, US Geological Survey.
-
- Bettez ND, Duncan JM, Groffman PM, Band LE, O’Neil-Dunne J, Kaushal SS, et al. (2015). Climate variation overwhelms efforts to reduce nitrogen delivery to coastal waters. Ecosystems, 18(8), 1319–1331.
-
- Bowman DM, Williamson GJ, Abatzoglou JT, Kolden CA, Cochrane MA, & Smith AM (2017). Human exposure and sensitivity to globally extreme wildfire events. Nature Ecology & Evolution, 1, 0058. - PubMed
Grants and funding
LinkOut - more resources
Full Text Sources