. 2023 Apr 6:16:1146525.
doi: 10.3389/fnmol.2023.1146525. eCollection 2023.

Integrating transcriptomics and metabolomics to analyze the mechanism of hypertension-induced hippocampal injury

Affiliations

Integrating transcriptomics and metabolomics to analyze the mechanism of hypertension-induced hippocampal injury

Yanan Li et al. Front Mol Neurosci. .

Abstract

Objective: Hypertension is a public health challenge worldwide due to its high prevalence and multiple complications. Hypertension-induced damage to the hippocampus leads to behavioral changes and various brain diseases. Despite the multifaceted effects of hypertension on the hippocampus, the mechanisms underlying hippocampal lesions are still unclear.

Methods: The 32-week-old spontaneously hypertensive rats (SHR) and Wistar-Kyoto (WKY) rats were selected as the study subjects. Behavioral experiments such as an open field test (OFT), an elevated plus maze (EPM) test, and the Morris water maze (MWM) test were performed to show the behavioral characteristics of the rats. A comprehensive transcriptomic and metabolomic analysis was performed to understand the changes in the hippocampus at the metabolic and genetic levels.

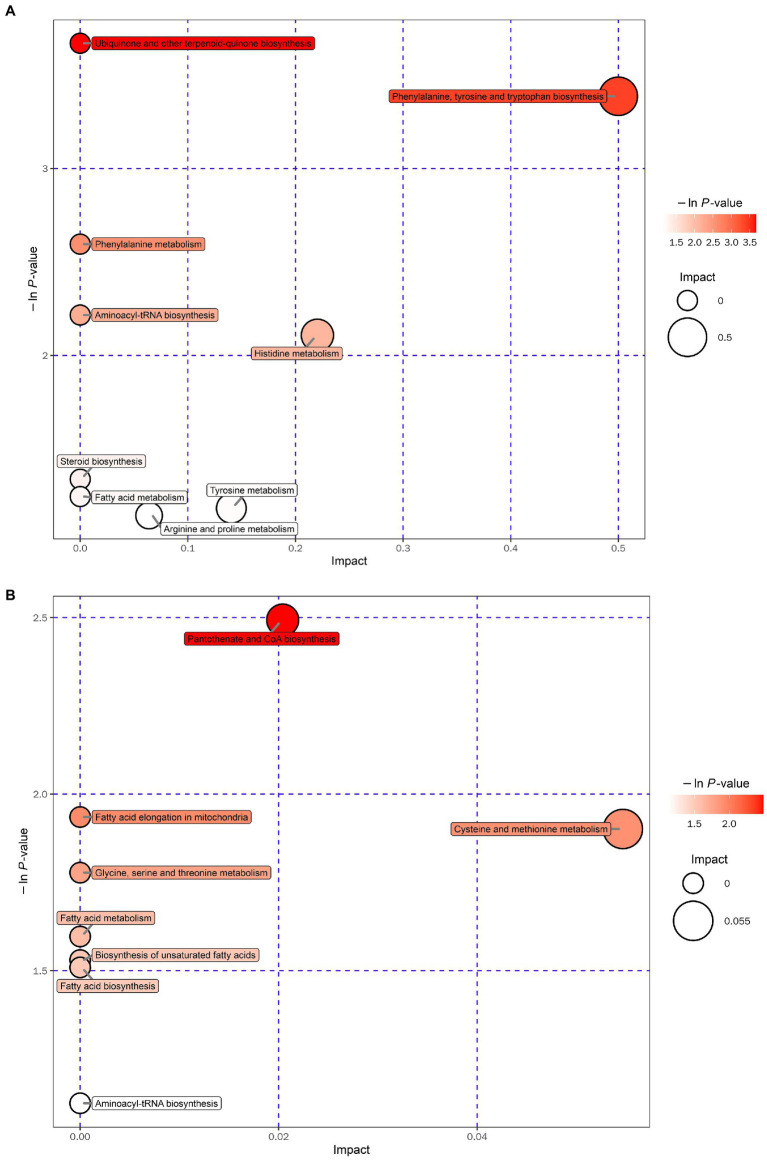
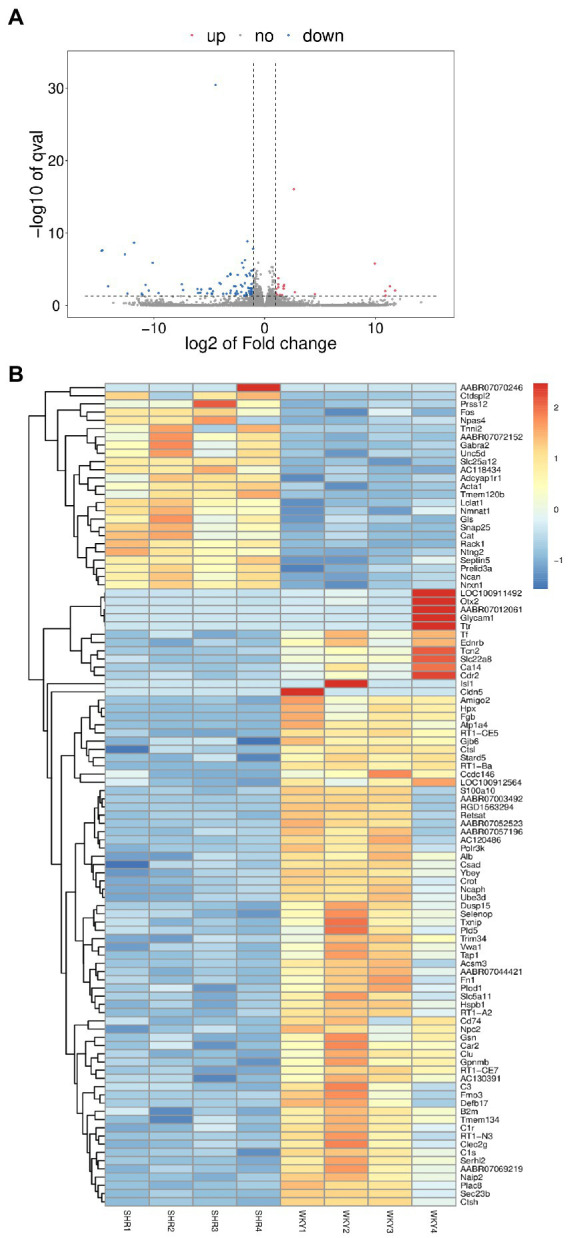
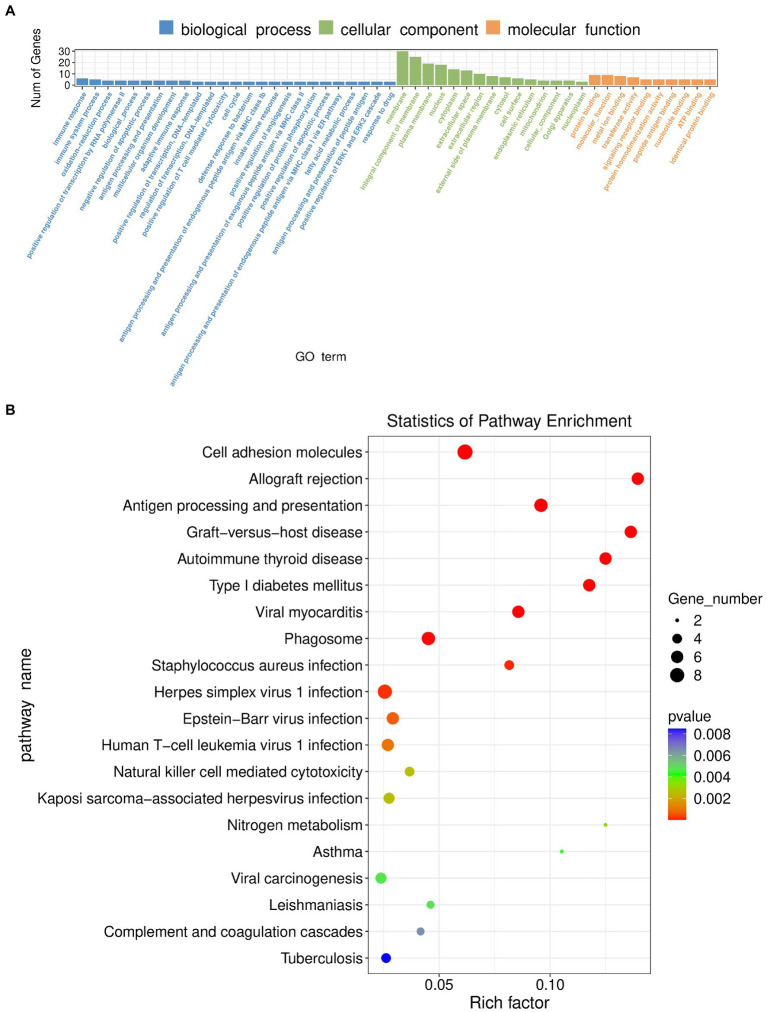
Results: Behavioral tests showed that, compared to WKY rats, SHR showed not only reduced memory capacity but more hyperactive and impulsive behavior. In addition, transcriptomic analysis screened for 103 differentially expressed genes. Metabolomic analysis screened 56 metabolites with significant differences, including various amino acids and their related metabolites.

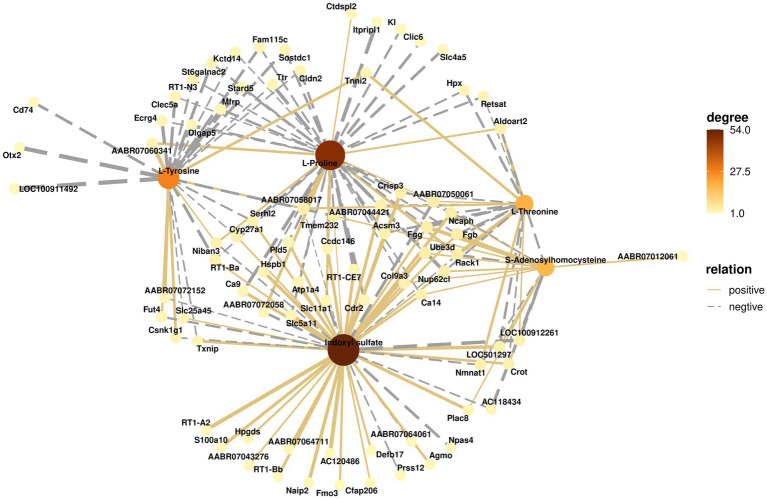
Conclusion: Comprehensive analysis showed that hypertension-induced hippocampal lesions are closely associated with differential metabolites and differential genes detected in this study. The results provide a basis for analyzing the mechanisms of hypertension-induced hippocampal damage.

Keywords: hippocampus; hypertension; metabolomics; spontaneously hypertensive rats; transcriptomics.


Conflict of interest statement

The authors declare that the research was conducted in the absence of any commercial or financial relationships that could be construed as a potential conflict of interest.

Figures

Figure 1
Figure 1
Experimental behavioral results of SHR and WKY rats. (A) Representative trajectory plots of rats in the open field test. (B) Total distance traveled by rats in the open field test. (C) Representative trajectory plots of rats in the elevated plus maze. (D) Time spent by rats in the open arm. (E) Representative trajectory plot of the rat in the water maze. (F) Time spent by rats in the target quadrant. Experimental data are expressed as mean ± SD. *p < 0.05, **p < 0.01.
Figure 2
Figure 2
(A) Score scatter plot of the OPLS-DA model for the positive ion mode. (B) Score scatter plot of the OPLS-DA model for the negative ion mode. (C) Volcano plot for the positive ion mode. (D) Volcano plot for the negative ion mode.
Figure 3
Figure 3
Heatmap of hierarchical clustering analysis for the SHR and WKY groups (A: positive ion mode. B: negative ion mode).
Figure 4
Figure 4
Heatmap of the correlation analysis for the SHR and WKY groups (A: positive ion mode. B: negative ion mode). Red represents positive correlations, blue represents negative correlations, and darker colors represent stronger correlations.
Figure 5
Figure 5
Bubble plot for the SHR and WKY groups (A: positive ion mode. B: negative ion mode).
Figure 6
Figure 6
(A) Volcano plot of differentially expressed genes. (B) Heatmap of differentially expressed genes.
Figure 7
Figure 7
(A) GO enrichment classification histogram in transcriptomics. (B) KEGG enrichment analysis bubble plot in transcriptomics.
Figure 8
Figure 8
Correlation network analysis of metabolites and genes. The solid line connecting metabolites and genes represents a positive correlation, and the dashed line represents a negative correlation. The darker the color of the metabolite, the greater the number of related genes.

References

    1. Banoglu E., King R. S. (2002). Sulfation of indoxyl by human and rat aryl (phenol) sulfotransferases to form indoxyl sulfate. Eur. J. Drug Metab. Pharmacokinet. 27, 135–140. doi: 10.1007/BF03190428, PMID: - DOI - PMC - PubMed
    1. Bartel J., Krumsiek J., Schramm K., Adamski J., Gieger C., Herder C., et al. . (2015). The human blood metabolome-transcriptome interface. PLoS Genet. 11:e1005274. doi: 10.1371/journal.pgen.1005274, PMID: - DOI - PMC - PubMed
    1. Bhat A. H., Dar K. B., Anees S., Zargar M. A., Masood A., Sofi M. A., et al. . (2015). Oxidative stress, mitochondrial dysfunction and neurodegenerative diseases; a mechanistic insight. Biomed. Pharmacother. 74, 101–110. doi: 10.1016/j.biopha.2015.07.025 - DOI - PubMed
    1. Brydges C. R., Fiehn O., Mayberg H. S., Schreiber H., Dehkordi S. M., Bhattacharyya S., et al. . (2021). Indoxyl sulfate, a gut microbiome-derived uremic toxin, is associated with psychic anxiety and its functional magnetic resonance imaging-based neurologic signature. Sci. Rep. 11, 21011–21014. doi: 10.1038/s41598-021-99845-1, PMID: - DOI - PMC - PubMed
    1. den Heijer T., Launer L., Prins N., van Dijk E. J., Vermeer S., Hofman A., et al. . (2005). Association between blood pressure, white matter lesions, and atrophy of the medial temporal lobe. Neurology 64, 263–267. doi: 10.1212/01.WNL.0000149641.55751.2E, PMID: - DOI - PubMed

LinkOut - more resources