. 2023 Apr 5:14:1163694.
doi: 10.3389/fphar.2023.1163694. eCollection 2023.

Vitamin C and vitamin D3 alleviate metabolic-associated fatty liver disease by regulating the gut microbiota and bile acid metabolism via the gut-liver axis

Affiliations

Vitamin C and vitamin D3 alleviate metabolic-associated fatty liver disease by regulating the gut microbiota and bile acid metabolism via the gut-liver axis

Qingling Chen et al. Front Pharmacol. .

Abstract

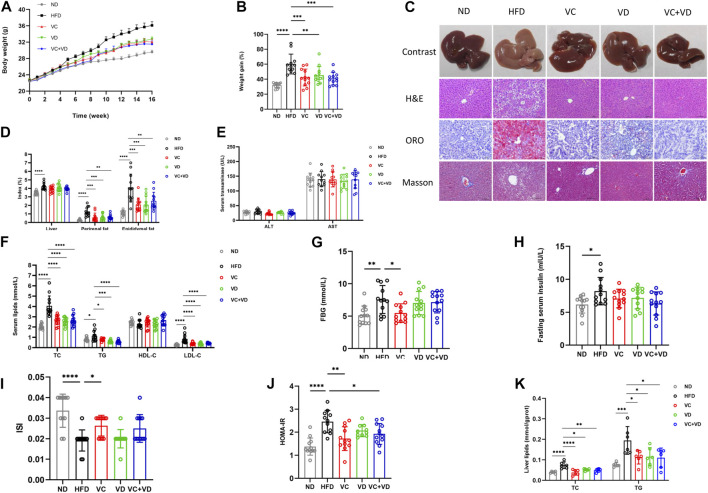
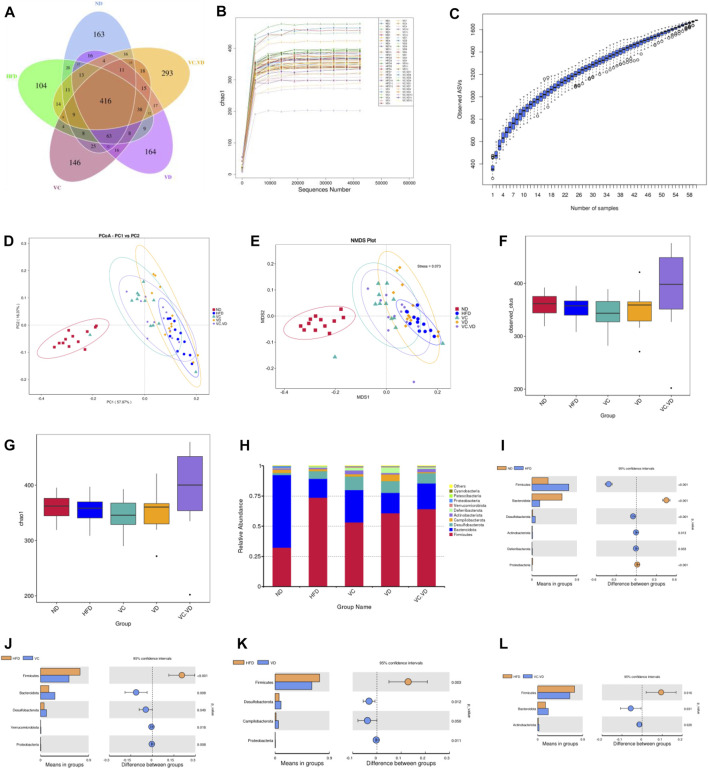
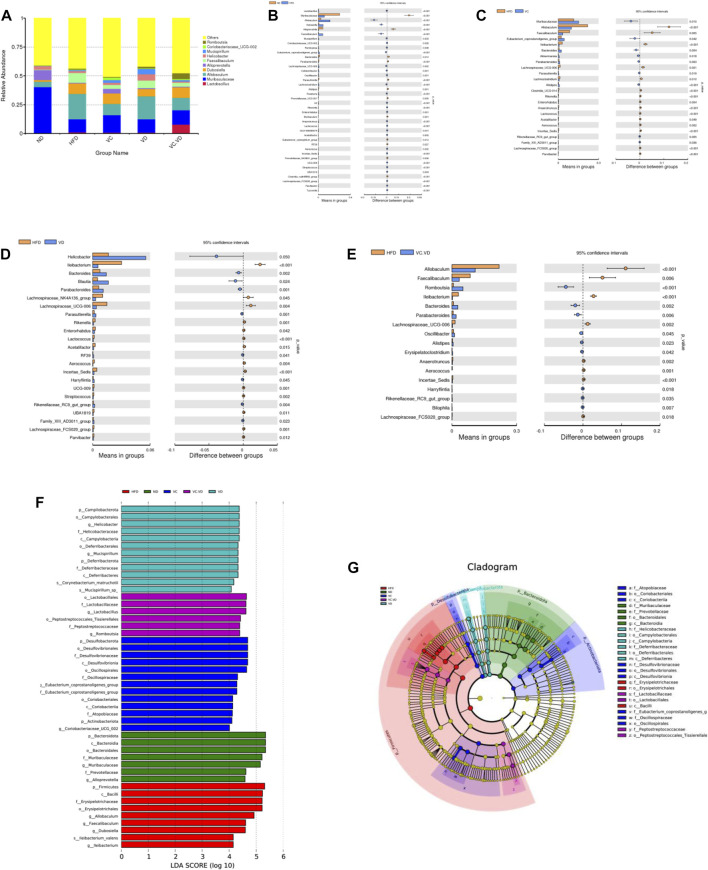
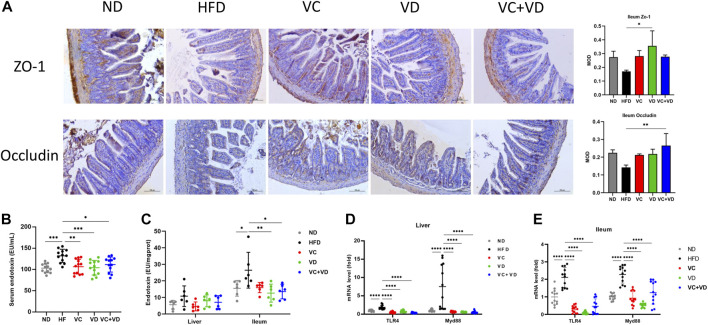
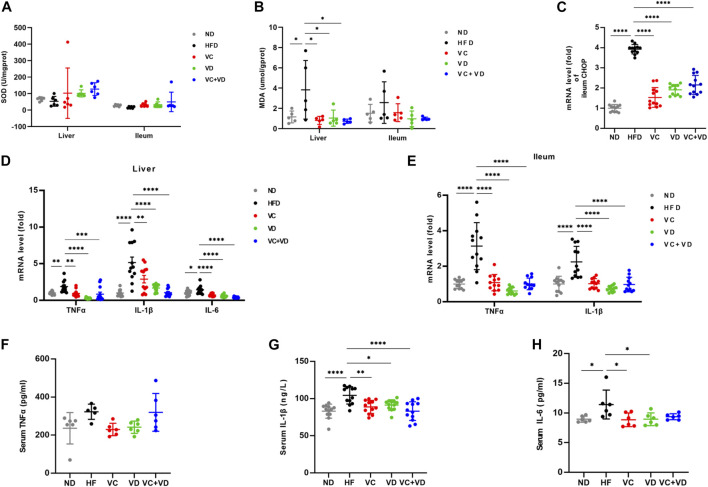
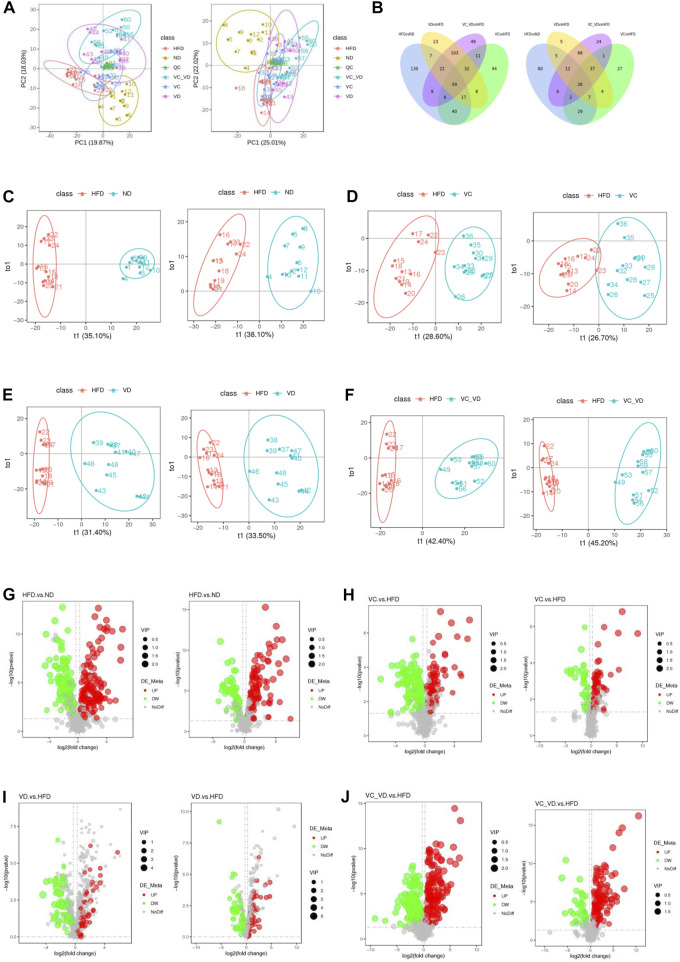
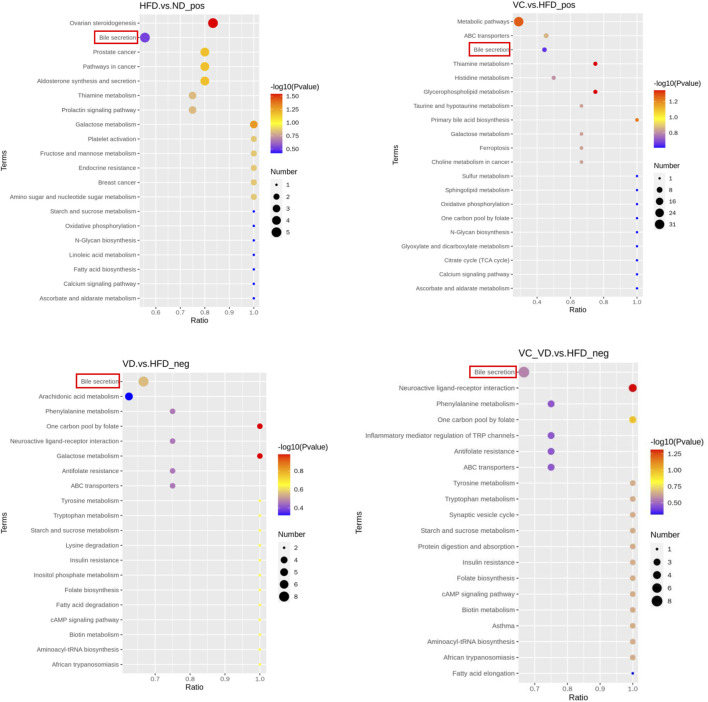
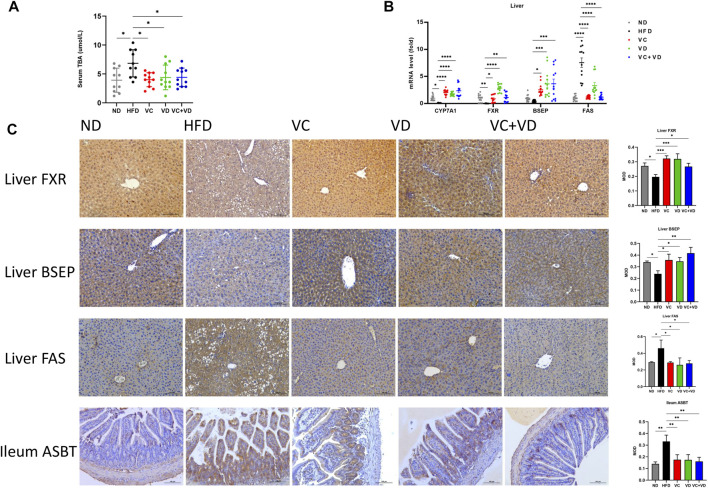
Background: Previous studies have demonstrated that both vitamin C (VC) and vitamin D3 (VD3) have therapeutic potential against metabolic disorders, including obesity, diabetes, and metabolic-associated fatty liver disease (MAFLD). However, it is unclear whether VC supplementation is associated with improving the intestinal flora and regulating the metabolism of bile acids via the gut-liver axis in MAFLD. There is still no direct comparison or combination study of these two vitamins on these effects. Methods: In this study, we employed biochemical, histological, 16S rDNA-based microbiological, non-targeted liver metabolomic, and quantitative real-time polymerase chain reaction analyses to explore the intervening effect and mechanism of VC and VD3 on MAFLD by using a high-fat diet (HFD)-induced obese mouse model. Results: Treatment of mice with VC and VD3 efficiently reversed the characteristics of MAFLD, such as obesity, dyslipidemia, insulin resistance, hepatic steatosis, and inflammation. VC and VD3 showed similar beneficial effects as mentioned above in HFD-induced obese mice. Interestingly, VC and VD3 reshaped the gut microbiota composition; improved gut barrier integrity; ameliorated oxidative stress and inflammation in the gut-liver axis; inhibited bile acid salt reflux-related ASBT; activated bile acid synthesis-related CYP7A1, bile acid receptor FXR, and bile acid transportation-related BSEP in the gut-liver axis; and improved bile secretion, thus decreasing the expression of FAS in the liver and efficiently ameliorating MAFLD in mice. Conclusion: Together, the results indicate that the anti-MAFLD activities of VC and VD3 are linked to improved gut-liver interactions via regulation of the gut microbiota and bile acid metabolism, and they may therefore prove useful in treating MAFLD clinically.

Keywords: bile acid metabolism; gut microbiota; gut-liver axis; metabolic-associated fatty liver disease; vitamin C; vitamin D3.


Conflict of interest statement

The authors declare that the research was conducted in the absence of any commercial or financial relationships that could be construed as a potential conflict of interest.

Figures

FIGURE 1
FIGURE 1
VC and VD3 attenuated MAFLD in obese mice. (A) Effects of VC and VD3 on body weight changes. (B) Body weight gain as a percentage of baseline weight for each group. (C) Pathologic examination of the liver by H&E staining, oil red O staining, and Masson staining. Representative images were captured. Scale bar, 100 μm. (D) The liver index, perirenal fat index, and epididymal fat index. (E) Serum levels of ALT and AST. (F) Serum lipids, including TC, TG, HDL-C, and LDL-C. (G) Fasting blood glucose. (H) Fasting serum insulin. (I) Insulin sensitivity index. (J) Homeostasis model assessment of insulin resistance. (K) Hepatic TC and TG levels. Data are shown as the means ± SDs (n = 12 mice/group), *p < 0.05, **p < 0.01, ***p < 0.001, ****p < 0.0001.
FIGURE 2
FIGURE 2
VC and VD3 improved the gut microbiota in obese mice. (A) Venn diagram of the ASVs from the gut microbiota. (B) Rarefaction curve of chao1. (C) Species accumulation boxplot. (D–E) Weighted UniFrac PCoA and NMDS analysis of the gut microbiota based on the ASV data. (F–G) Alpha diversity analyzed by the observed_otus and chao1 index. (H) Relative abundances at the phylum level. (I–L) Discrepancy in the gut microbiota composition between groups at the phylum level. Species with significant differences between the ND and HFD groups (I), HFD and VC groups (J), HFD and VD groups (K), and HFD and VC + VD groups (L) were analyzed. A significant discrepancy was defined as p < 0.05 according to the t-test. (n = 12 mice/group).
FIGURE 3
FIGURE 3
VC and VD3 improved the gut microbiota in obese mice. (A) Relative abundances at the genus level. (B–E) Discrepancy in the gut microbiota composition between groups at the genus level. Species with significant differences between the ND and HFD groups (B), HFD and VC groups (C), HFD and VD groups (D), and HFD and VC + VD groups (E) were analyzed. A significant discrepancy was defined as p < 0.05 according to the t-test. (F) LEfSe analysis of the dominant biomarker taxa among the five groups. The threshold of the logarithmic score of LDA was 4.0. (G) Taxonomic cladogram obtained from LEfSe analysis by comparing the 5 groups. (n = 12 mice/group).
FIGURE 4
FIGURE 4
VC and VD3 improved gut barrier integrity and endotoxemia in obese mice. (A) Immunohistochemistry analysis of ZO-1 and Occludin in the ileum of mice. The brown dot indicates the target protein. Representative images were captured. Scale bar, 100 µm. (B) Serum levels of endotoxin. (C) Endotoxin levels in the liver and ileum. (D) Endotoxin-associated gene expression in the liver. (E) Endotoxin-associated gene expression in the ileum. The gene level in the ND group was set as 1, and the relative fold increases were determined by comparison with the ND group. Data are shown as the means ± SDs (n = 12 mice/group), *p < 0.05, **p < 0.01, ***p < 0.001, ****p < 0.0001.
FIGURE 5
FIGURE 5
VC and VD3 ameliorated oxidative stress and inflammation in the gut-liver axis in obese mice. (A) SOD of the liver and ileum. (B) MDA of the liver and ileum. (C) Gene expression of C/EBP-homologous protein in the ileum of mice. (D) Proinflammation-associated gene expression in the liver. (E) Proinflammation-associated gene expression of the ileum. The gene level in the ND group was set as 1, and the relative fold increases were determined by comparison with the ND group. (F) Serum TNFα. (G) Serum IL-1β. (H) Serum IL-6. Data are shown as the means ± SDs (n = 12 mice/group), *p < 0.05, **p < 0.01, ***p < 0.001, ****p < 0.0001.
FIGURE 6
FIGURE 6
Effect of VC and VD3 on liver metabolomic profiling in obese mice. (A) PCA score plots of the different groups in positive polarity (left) and negative polarity (right) modes. The quality control (QC) sample was prepared by mixing equal volumes of all the samples. (B) Venn diagrams displaying the number of differentially abundant metabolites that overlapped in the HFD vs. ND, VC vs. HFD, VD vs. HFD, and VC + VD vs. HFD comparisons in positive polarity (left) and negative polarity (right) modes. (C) OPLS-DA score plots of the HFD and ND groups in positive polarity (left) and negative polarity (right) modes. (D) OPLS-DA score plots of the HFD and VC groups in positive polarity (left) and negative polarity (right) modes. (E) OPLS-DA score plots of the HFD and VD groups in positive polarity (left) and negative polarity (right) modes. (F) OPLS-DA score plots of the HFD and VC + VD groups in positive polarity (left) and negative polarity (right) modes. (G) Volcano plots showing the dysregulated features between the HFD and ND groups in positive polarity (left) and negative polarity (right) modes. (H) Volcano plots for the VC and HFD groups in positive polarity (left) and negative polarity (right) modes. (I) Volcano plots for the VD and HFD groups in positive polarity (left) and negative polarity (right) modes. (J) Volcano plots for the VC + VD and HFD groups in positive polarity (left) and negative polarity (right) modes.
FIGURE 7
FIGURE 7
KEGG_Enrich.scatterplot. KEGG_Enrich.scatterplot (top 20) of the HFD vs. ND, VC vs. HFD, VD vs. HFD, and VC + VD vs. HFD groups; pos, positive polarity mode; neg, negative polarity mode. (n = 12 mice/group).
FIGURE 8
FIGURE 8
VC and VD3 attenuated bile acid metabolism dysfunction in the gut-liver axis in obese mice. (A) Serum levels of total bile acid. (B) Expression of mRNAs involved in the regulation of the synthesis and transport of bile acids and fatty acid synthase (FAS) in the liver. (C) Immunohistochemistry analysis of FXR, BSEP, and FAS in the liver and ASBT in the ileum of mice. The brown dot indicates the target protein. Representative images were captured. Scale bar, 100 µm. Data are shown as the means ± SDs (n = 12 mice/group), *p < 0.05, **p < 0.01, ***p < 0.001, ****p < 0.0001.

References

    1. Baeke F., Takiishi T., Korf H., Gysemans C., Mathieu C. (2010). Vitamin D: Modulator of the immune system. Curr. Opin. Pharmacol. 10, 482–496. 10.1016/j.coph.2010.04.001 - DOI - PubMed
    1. Barchetta I., Angelico F., Del B. M., Baroni M. G., Pozzilli P., Morini S., et al. (2011). Strong association between non alcoholic fatty liver disease (NAFLD) and low 25(OH) vitamin D levels in an adult population with normal serum liver enzymes. BMC Med. 9, 85. 10.1186/1741-7015-9-85 - DOI - PMC - PubMed
    1. Barchetta I., Cimini F. A., Cavallo M. G. (2020). Vitamin D and metabolic dysfunction-associated fatty liver disease (MAFLD): An update. Nutrients 12, 3302. 10.3390/nu12113302 - DOI - PMC - PubMed
    1. Barrea L., Muscogiuri G., Annunziata G., Laudisio D., de Alteriis G., Tenore G. C., et al. (2019). A new light on vitamin D in obesity: A novel association with trimethylamine-N-oxide (tmao). Nutrients 11, 1310. 10.3390/nu11061310 - DOI - PMC - PubMed
    1. Chen J., Thomsen M., Vitetta L. (2019). Interaction of gut microbiota with dysregulation of bile acids in the pathogenesis of nonalcoholic fatty liver disease and potential therapeutic implications of probiotics. J. Cell Biochem. 120, 2713–2720. 10.1002/jcb.27635 - DOI - PubMed