[Preprint]. 2023 Nov 15:arXiv:2304.05908v3.

Altered Topological Structure of the Brain White Matter in Maltreated Children through Topological Data Analysis

Affiliations

Altered Topological Structure of the Brain White Matter in Maltreated Children through Topological Data Analysis

Moo K Chung et al. ArXiv. .

Update in

Abstract

Childhood maltreatment may adversely affect brain development and consequently influence behavioral, emotional, and psychological patterns during adulthood. In this study, we propose an analytical pipeline for modeling the altered topological structure of brain white matter in maltreated and typically developing children. We perform topological data analysis (TDA) to assess the alteration in the global topology of the brain white-matter structural covariance network among children. We use persistent homology, an algebraic technique in TDA, to analyze topological features in the brain covariance networks constructed from structural magnetic resonance imaging (MRI) and diffusion tensor imaging (DTI). We develop a novel framework for statistical inference based on the Wasserstein distance to assess the significance of the observed topological differences. Using these methods in comparing maltreated children to a typically developing control group, we find that maltreatment may increase homogeneity in white matter structures and thus induce higher correlations in the structural covariance; this is reflected in the topological profile. Our findings strongly suggest that TDA can be a valuable framework to model altered topological structures of the brain. The MATLAB codes and processed data used in this study can be found at https://github.com/laplcebeltrami/maltreated.


Figures

Figure 1.
Figure 1.
Proposed topological inference pipeline for analyzing structural covariance networks. Given two weighted graphs G1,G2, we first perform the birth-death decomposition and partition the edges into sorted birth and death sets (section 2.1). The 0D topological distance between birth values quantifies discrepancies in connected components (section 2.2). The 1D topological distance between death values quantifies discrepancies in cycles. Topological inference is based on the ratio of between-group distance lB to within-group distance lW (section 2.3). Statistical significance on the ratio ϕ=lB/lW is assessed using the transposition test, a scalable online permutation test.
Figure 2.
Figure 2.
Illustration of a graph filtration with corresponding birth-death decomposition. During the graph filtration, edges are removed one at a time, starting from the smallest edge weight to the largest. Each edge removal either creates a new connected component (highlighted in red) or eliminates a cycle (highlighted in blue). The parameter β0, which counts the number of connected components, is monotonically non-decreasing, while β1, which counts the number of cycles. Thus, the edges can be decomposed into birth and death sets: the birth set corresponds to the maximum spanning tree (MST), and the death set comprises non-MST edges. The birth set forms the 0D persistence diagram, while the death set forms the 1D persistence diagram.
Figure 3.
Figure 3.
Networks in Groups 2, 3, and 4 are generated by rotating those in Group 1. Since these networks are topologically equivalent, one would not expect to see any clustering pattern in the distance matrix. However, the distance matrix based on the Euclidean distance (L2-norm) exhibits a clustering pattern. In contrast, the topological distance, computed using the Wasserstein distance, does not display any such block pattern.
Figure 4.
Figure 4.
The distribution of within- and between-group distances obtained from Jackknife resampled structural covariance networks. The within- and between-group distances are statistically independent and thus we can compute the Z-statistic out of the distances.
Figure 5.
Figure 5.
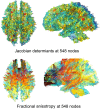
548 uniformly sampled nodes along the white matter surface. The nodes are sparsely sampled on the template white matter surface to guarantee there is no spurious high correlation due to proximity between nodes. The same nodes are taken in both MRI and DTI for comparison between the two modalities. Bottom: curves are extracted white matter fiber tracts from a subject.
Figure 6.
Figure 6.
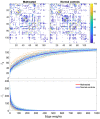
Top: The average structural connectivity in maltreated children compared to normal controls. Bottom: Individual Betti curves for each subject are displayed. The thick red and blue curves represent the average Betti curves for the maltreated and control groups, respectively. Given that structural connectivity predominantly forms a single, large connected tree, there is minimal variation in the topological profiles. Thus, no statistically significant topological differences were detected between the groups.
Figure 7.
Figure 7.
Structural covariance networks on 548 nodes, generated from fractional anisotropy (FA) values derived from DTI and Jacobian determinants derived from T1-MRI. The networks are thresholded at values of 0.5, 0.6, 0.7, and 0.8, shown from top to bottom. The color bar represents the correlation values for each edge.
Figure 8.
Figure 8.
The Betti curves are derived from the Jackknife-resampled structural covariance networks for both the Jacobian determinants (left) and FA-values (right). Compared to the Jacobian determinants, the FA-values exhibit significantly less variability in their topological profiles.

References

    1. Aber J. and Cicchetti D.. The socio-emotional development of maltreated children: An empirical and theoretical analysis. In Theory and Research in Behavioral Pediatrics: Volume 2, pages 147–205. Springer, 1984.
    1. Adams H., Emerson T., Kirby M., Neville R., Peterson C., Shipman P., Chepushtanova S., Hanson E., Motta F., and Ziegelmeier L.. Persistence images: A stable vector representation of persistent homology. Journal of Machine Learning Research, 18, 2017.
    1. Avants B. B., Epstein C. L., Grossman M., and Gee J. C.. Symmetric diffeomorphic image registration with cross-correlation: evaluating automated labeling of elderly and neurodegenerative brain. Medical image analysis, 12(1):26–41, 2008. - PMC - PubMed
    1. Baer J. and Martinez C.. Child maltreatment and insecure attachment: A meta-analysis. Journal of reproductive and infant psychology, 24:187–197, 2006.
    1. Besthorn C., Sattel H., Geiger-Kabisch C., Zerfass R., and Förstl H.. Parameters of eeg dimensional complexity in alzheimer’s disease. Electroencephalography and clinical neurophysiology, 95(2):84–89, 1995. - PubMed

Publication types

LinkOut - more resources