

Institution-Wide Analysis of Academic Outcomes Associated with Participation in UGR: Comparison of Different Research Modalities at a Hispanic-Serving Institution
- PMID: 37090426
- PMCID: PMC10121209
- DOI: 10.18833/spur/5/3/9
Institution-Wide Analysis of Academic Outcomes Associated with Participation in UGR: Comparison of Different Research Modalities at a Hispanic-Serving Institution
Abstract
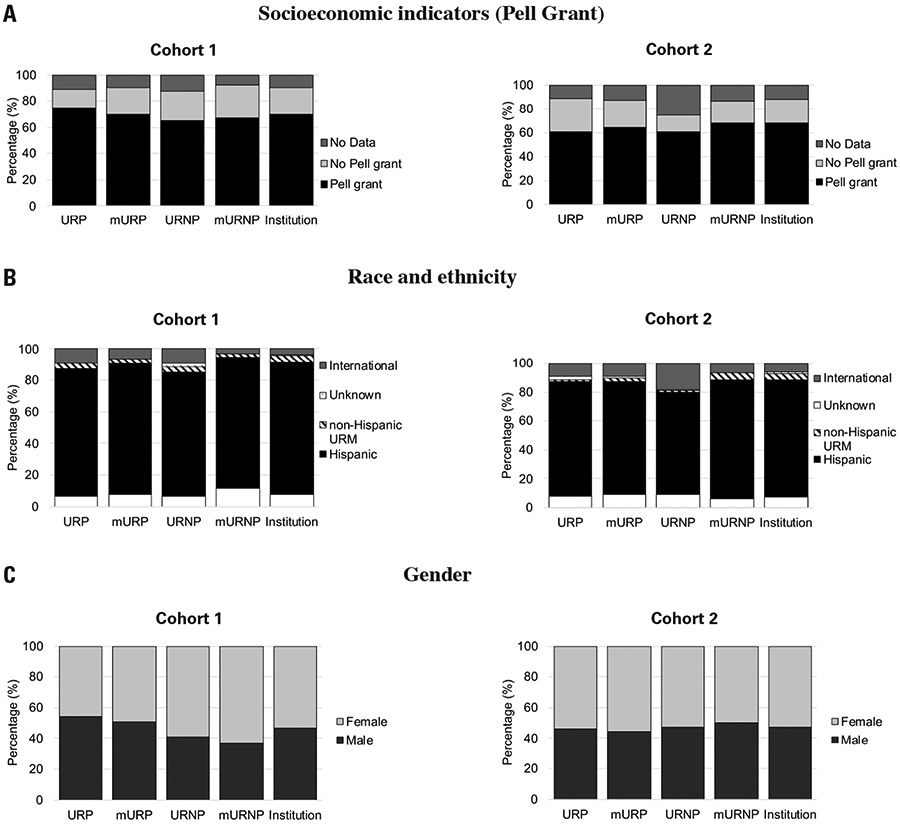
Most studies on the benefits of participation in undergraduate research (UGR) use data from student participants in undergraduate research programs (URPs), which offer a limited number of positions. In reality, however, the majority of UGR students participate in undergraduate research not in programs (URNPs). The authors conducted an institution-wide study at a Hispanic-serving institution to examine the relationship between academic success and participation in these two UGR modalities. Although there were some differences between URPs and URNPs, participation in research at this institution was largely equitable and inclusive, with UGR demographics that reflected those of the institution, and it was positively associated with increased benefits along multiple academic metrics, regardless of UGR modality. Importantly, these increases were observed for both first time in college and transfer students.
Keywords: UGR; UGR experiences; equity; high-impact educational practices; inclusion; research apprenticeship; undergraduate research.
Conflict of interest statement
Conflict of Interest LADM served as Associate Director for COURI at UTEP from 2015–2019. LEE is the founding Director of COURI. Of the 13 UGR programs included in this study, 7 were implemented and managed by COURI. This research project was reviewed and approved by UTEP’s Institutional Review Board (IRB Reference # 1289740-1).
Figures


Similar articles
-
Undergraduate Research Participation Is Associated With Improved Student Outcomes at a Hispanic-Serving Institution.J Coll Stud Dev. 2017 May;58(4):583-600. doi: 10.1353/csd.2017.0044. J Coll Stud Dev. 2017. PMID: 30595620 Free PMC article.
-
Undergraduate research experiences: mentoring, awareness, and perceptions-a case study at a Hispanic-serving institution.Int J STEM Educ. 2018;5(1):9. doi: 10.1186/s40594-018-0105-8. Epub 2018 Apr 2. Int J STEM Educ. 2018. PMID: 30631699 Free PMC article.
-
The conundrum of social class: Disparities in publishing among STEM students in undergraduate research programs at a Hispanic majority institution.Sci Educ. 2018 Mar;102(2):283-303. doi: 10.1002/sce.21330. Epub 2017 Dec 10. Sci Educ. 2018. PMID: 30416213 Free PMC article.
-
Out-of-school settings as a developmental context for children and youth.Adv Child Dev Behav. 2005;33:43-77. doi: 10.1016/s0065-2407(05)80004-7. Adv Child Dev Behav. 2005. PMID: 16101114
-
Using Drosophila Oogenesis in the Classroom to Increase Student Participation in Biomedical Research.Methods Mol Biol. 2023;2626:381-398. doi: 10.1007/978-1-0716-2970-3_21. Methods Mol Biol. 2023. PMID: 36715917 Review.
Cited by
-
Factors and mediators impacting the number of undergraduate research mentees at a research-intensive Hispanic-serving institution.PLoS One. 2024 Oct 31;19(10):e0289386. doi: 10.1371/journal.pone.0289386. eCollection 2024. PLoS One. 2024. PMID: 39480838 Free PMC article.
-
Retention and Graduation of STEM Students at a Majority Hispanic Serving Institution: Effect of Participation in a Freshman Course-based Undergraduate Research Experiences Sequence.Chron Mentor Coach. 2024 Jun;8(1):103-115. doi: 10.62935/oz5265. Chron Mentor Coach. 2024. PMID: 39119331 Free PMC article.
References
-
- Adedokun Omolola A., Bessenbacher Ann B., Parker Loran C., Kirkham Lisa L., and Burgess Wilella D.. 2013. “Research Skills and STEM Undergraduate Research Students’ Aspirations for Research Careers: Mediating Effects of Research Self-Efficacy.” Journal of Research in Science Teaching 50(8): 940–951. doi: 10.1002/tea.21102 - DOI
-
- Auchincloss Lisa Corwin, Laursen Sandra L., Branchaw Janet L., Eagan Kevin, Graham Mark, Hanauer David I., Lawrie Gwendolyn, et al. 2014. “Assessment of Course-Based Undergraduate Research Experiences: A Meeting Report.” CBE—Life Sciences Education 13(1): 29–40. doi: 10.1187/cbe.14-01-0004 - DOI - PMC - PubMed
-
- Baron Sheila I, Brown Pamela, Cumming Tammie, and Mengeling Michelle. 2020. “The Impact of Undergraduate Research and Student Characteristics on Student Success Metrics at an Urban, Minority Serving, Commuter, Public Institution.” Journal of the Scholarship of Teaching and Learning 20(1): 85–104. doi: 10.14434/josotl.v20i1.25423 - DOI
-
- Bauer Karen W., and Bennett Joan S.. 2003. “Alumni Perceptions Used to Assess Undergraduate Research Experience.” The Journal of Higher Education 74(2): 210–230. doi: 10.1353/jhe.2003.0011 - DOI
-
- Brown Daniel A., Wright Nina B., Gonzalez Sylvia T., Weimer Nicholas E., and Soto Julio G.. 2020. “An Undergraduate Research Approach That Increased Student Success at a Hispanic-Serving Institution (HSI): The SURE Program at Texas State University.” Scholarship and Practice of Undergraduate Research (SPUR) 4(1): 52–62. https://eric.ed.gov/?id=EJ1275694
Grants and funding
LinkOut - more resources
Full Text Sources