. 2023 Mar 31:21:2434-2445.
doi: 10.1016/j.csbj.2023.03.051. eCollection 2023.

Towards mechanistic models of mutational effects: Deep learning on Alzheimer's Aβ peptide

Affiliations

Towards mechanistic models of mutational effects: Deep learning on Alzheimer's Aβ peptide

Bo Wang et al. Comput Struct Biotechnol J. .

Abstract

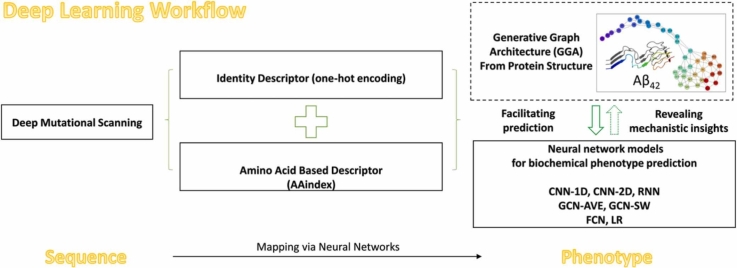
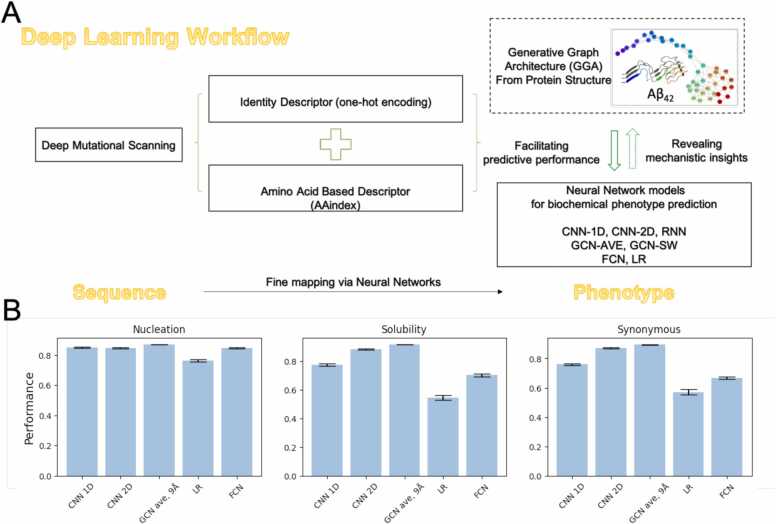
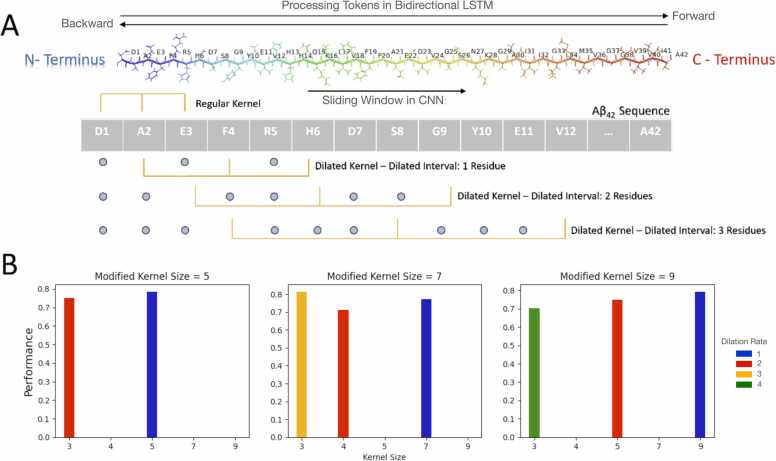
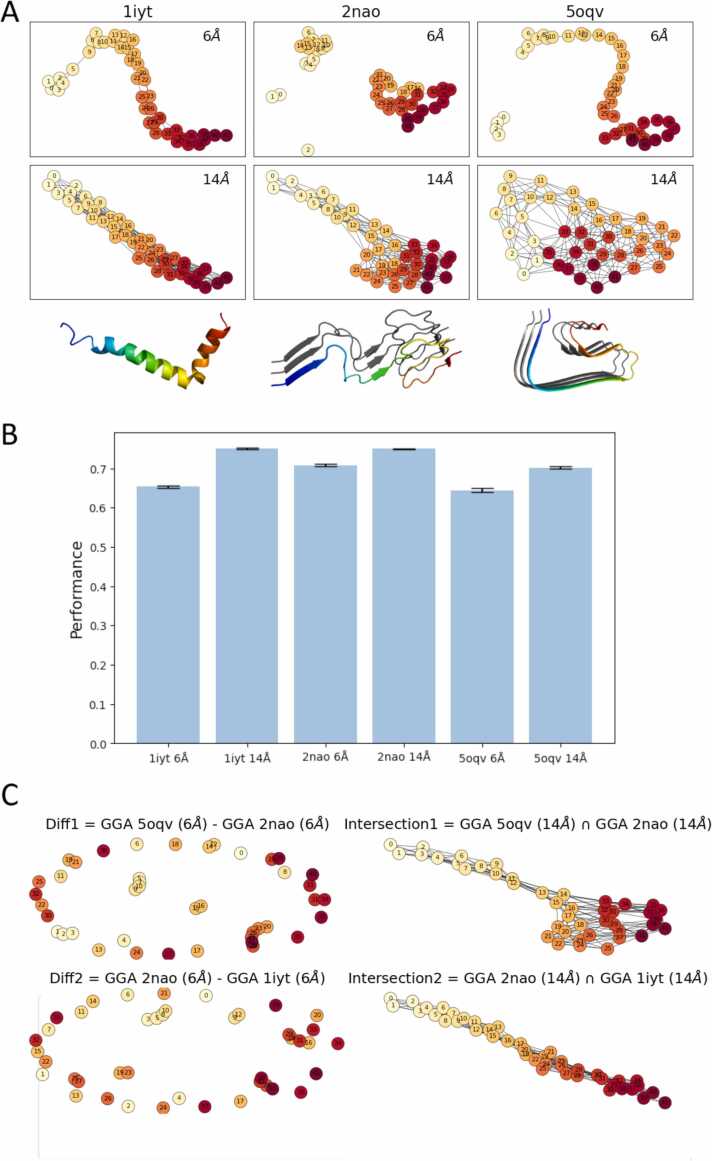
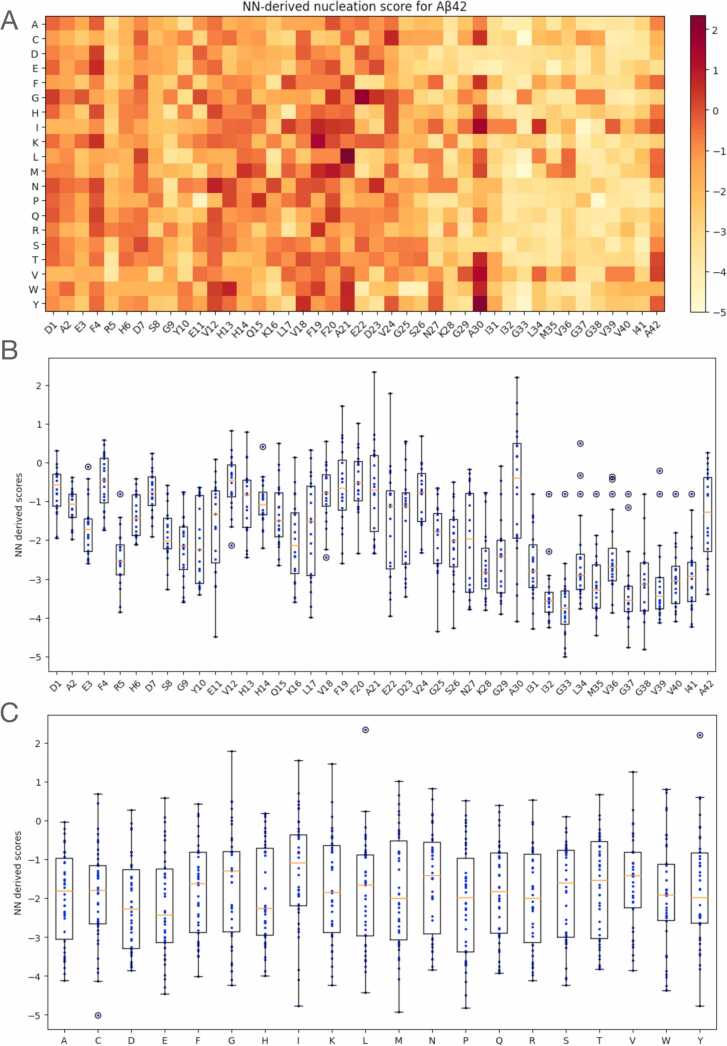
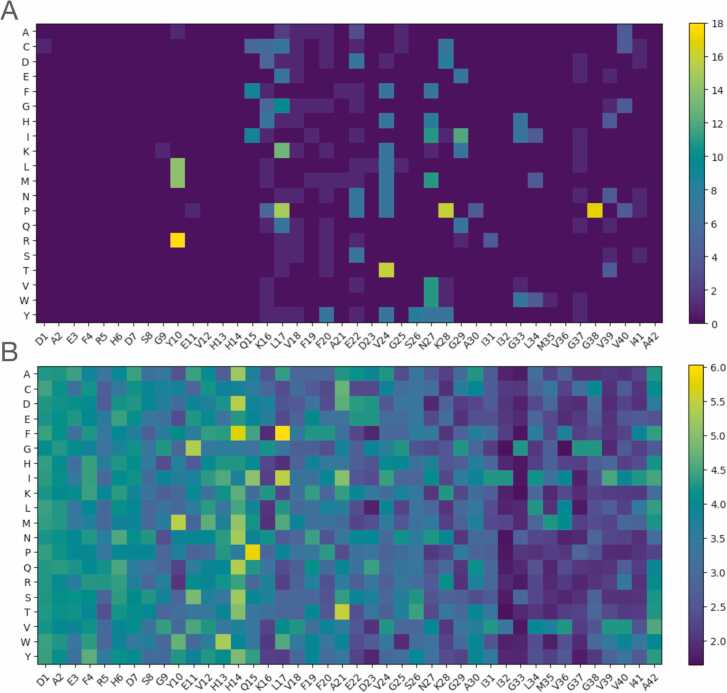
Deep Mutational Scanning (DMS) has enabled multiplexed measurement of mutational effects on protein properties, including kinematics and self-organization, with unprecedented resolution. However, potential bottlenecks of DMS characterization include experimental design, data quality, and depth of mutational coverage. Here, we apply deep learning to comprehensively model the mutational effect of the Alzheimer's Disease associated peptide Aβ42 on aggregation-related biochemical traits from DMS measurements. Among tested neural network architectures, Convolutional Neural Networks and Recurrent Neural Networks are found to be the most cost-effective models with high performance even under insufficiently-sampled DMS studies. While sequence features are essential for satisfactory prediction from neural networks, geometric-structural features further enhance the prediction performance. Notably, we demonstrate how mechanistic insights into phenotype may be extracted from the neural networks themselves suitably designed. This methodological benefit is particularly relevant for biochemical systems displaying a strong coupling between structure and phenotype such as the conformation of Aβ42 aggregate and nucleation, as shown here using a Graph Convolutional Neural Network (GCN) developed from the protein atomic structure input. In addition to accurate imputation of missing values (which here ranged up to 55% of all phenotype values at key residues), the mutationally-defined nucleation phenotype generated from a GCN shows improved resolution for identifying known disease-causing mutations relative to the original DMS phenotype. Our study suggests that neural network derived sequence-phenotype mapping can be exploited not only to provide direct support for protein engineering or genome editing but also to facilitate therapeutic design with the gained perspectives from biological modeling.

Keywords: Alzheimer's disease; Convolutional neural networks; Deep learning; Deep mutational scanning; Mutation; Neural networks; Nucleation; Recurrent neural networks.


Conflict of interest statement

Eric R. Gamazon receives an honorarium from the journal Circulation Research of the American Heart Association, as a member of the Editorial Board.

Figures

ga1
Graphical abstract
Fig. 1
Fig. 1
Neural networks for mapping the sequence – biochemical phenotype relationship for Aβ42. A. Our deep learning pipeline is built on the sequence-phenotype input from Deep Mutational Scanning (DMS). The pipeline leverages the Identity Descriptor (one-hot encoding) and the Amino Acid Based Descriptor (representing 566 intrinsic physicochemical properties of each amino acid). Generative Graph Architectures (GGAs) generated from protein structural information (i.e., atomic coordinates) are integrated into select neural network models for phenotype prediction. In addition, the neural network architectures along with the derived phenotype from each of the predictive models were used to extract mechanistic insights underlying established biological understanding. B. For each model, 10-fold cross validation was used to evaluate the prediction performance (Methods). The three phenotypes modeled here were nucleation, solubility, and ‘synonymous’ score. Model performances were compared across representative neural network models on each phenotype. Convolutional Neural Networks (CNNs) demonstrated robustly strong performance for all phenotypes, with Graph Convolutional Neural Networks (in particular, GCN-AVE) outperforming all models, while the baseline models, Linear Regression (LR) and a Fully-Connected Neural Network (FCN), performed reasonably well for nucleation, the phenotype with the largest (two orders of magnitude greater) training data, but showed significantly degraded performance for the other two phenotypes (Table S1). For example, LR achieved good performance for nucleation (0.762649 ± 0.00674) but significantly lower performance for solubility (0.544730 ± 0.01738) and ‘synonymous’ score (0.570620 ± 0.01885).
Fig. 2
Fig. 2
Architectures and performance of sequence-based models. A.42 is colored with the “rainbow” scheme from the N-Terminus (blue) to the C-Terminus (red) end. Each amino acid is represented as a one-letter code. In a Recurrent Neural Network (RNN) LSTM architecture, connections between nodes constitute a directed graph along a sequence of time steps, with the LSTM providing a solution to the vanishing gradient problem associated with a RNN (Methods). While bidirectional LSTM enables the network to exploit context on both sides of each position via two independent RNNs (Forward and Backward), 1D Convolutional Neural Network (CNN-1D) slides from the N- to the C- terminus with regular and dilated kernels. A dilated kernel covers a larger convolutional window with selected non-adjacent neighboring residues, enabling evaluation of their contribution to prediction performance. Here, interval residues are shown as gray dots. B. Model performance of one-layer CNN-1D with varying modified kernel size kor dilation rate αN, α1 (Table S2) for the solubility phenotype. The performance of each network model was evaluated via 10-fold cross validation using the Spearman coefficient correlation between the observed and predicted phenotype (Methods). Increasing the dilation rate with the same kernel size yielded a larger convolutional window, but performance was often degraded (Table S2), suggesting the importance of local information and neighboring interactions.
Fig. 3
Fig. 3
Biological inferences from Single Weight Graph Convolutional Neural Networks (GCN-SW). A. Generative Graph Architectures (GGAs) generated from three Protein Data Bank structures (determined by NMR spectroscopy or cryo-electron microscopy), 1iyt, 2nao and 5oqv, with two representative Euclidean distance thresholds, 6 Å and 14 Å. Each residue is represented by a node while the presence of a connecting edge between nodes is determined by whether the Euclidean distance between the residues (calculated from the atomic coordinates of the corresponding β-carbons) is within the chosen distance threshold. Thus, chemically, the edges may represent intermolecular interactions, including covalent bonds, hydrogen bonds or van der Waals interactions between consecutive residues or non-consecutive residues. Nodes from GGAs were mapped to the protein sequence (with each node labeled by the corresponding residue's position) and colored from the N-terminus (yellow) to C-terminus (red), which is here also reflected in the protein tertiary structure (in third row). The GGAs for the alpha-helix-rich 1iyt resembled the connected peptide backbone while 2nao and 5oqv, both in mature fibril conformations, displayed multiple connected components (including a subset of disordered N-terminus residues) at 6 Å. Diverse structural inputs of protein atomic coordinates lead to contrasting GGAs. B. Model performance of GCN-SW (filter size=1, number of layers=1) in predicting nucleation based on the six GGAs, implemented as described in the text. C. New graph networks derived from graph operations (Difference and Intersection; Methods) on the initial six GGAs. The starting node index for each plot is 0, i.e., the residues are labeled from 0 to 41.
Fig. 4
Fig. 4
Mutational effects on nucleation in Aβ42. A. Heatmap and B. boxplots generated from our NN-derived nucleation score show the effects of all possible mutations at every single position along the sequence. One benefit of the NN-derived map is the imputation of missing values, which ranged up to 55% at “gatekeeper” residues (as defined by Seuma et al.). The C-terminus (S26-A42) had significantly lower NN-derived nucleation than the N-terminus (Mann-Whitney U test, p < 2.2x10¹⁶). The threshold for the NN-derived score that discriminates positive or negative nucleation effect, equal to the mode of the distribution, is located at − 0.849. C. Mutational effects for each of 20 amino acids (x-axis) are summarized for all positions in the Aβ42 peptide using the NN-derived, mutationally-determined nucleation score (y-axis).
Fig. 5
Fig. 5
Feature attribution. To enhance interpretation of the CNN-1D model on nucleation, we applied the "Integrated Gradients" (IG) method (Methods). For each pair consisting of a residue in Aβ42 (x-axis) and a mutation at the residue (y-axis), the top panel shows which feature produced the maximum IG score for the given pair while the bottom panel shows the value of the maximum IG score for the pair. Nineteen such unique features were found, and these are labeled here from 0 to 18 (see Supplementary Information for the dictionary). For example, the hydrophobic residue L17 displays a list of features that attained a maximum IG score.

Similar articles

Cited by

References

    1. Hardy J., Selkoe D.J. The amyloid hypothesis of Alzheimer’s disease: progress and problems on the road to therapeutics. Science. 2002;297:353–356. - PubMed
    1. Bekris L.M., Yu C.-E., Bird T.D., Tsuang D.W. Genetics of Alzheimer disease. J Geriatr Psychiatry Neurol. 2010;23:213–227. - PMC - PubMed
    1. Seuma M., Faure A., Badia M., Lehner B., Bolognesi B. The genetic landscape for amyloid beta fibril nucleation accurately discriminates familial Alzheimer’s disease mutations. eLife. 2021;10 - PMC - PubMed
    1. Ge X., Sun Y., Ding F. Structures and dynamics of β-barrel oligomer intermediates of amyloid-beta16-22 aggregation. Biochim Biophys Acta BBA - Biomembr. 2018;1860(1687–1697) - PMC - PubMed
    1. Wang B., et al. Modulating protein amyloid aggregation with nanomaterials. Environ Sci Nano. 2017;4:1772–1783. - PMC - PubMed

LinkOut - more resources