. 2023 Mar 25:21:2502-2513.
doi: 10.1016/j.csbj.2023.03.044. eCollection 2023.

CDEMI: Characterizing differences in microbial composition and function in microbiome data

Affiliations

CDEMI: Characterizing differences in microbial composition and function in microbiome data

Lidan Wang et al. Comput Struct Biotechnol J. .

Abstract

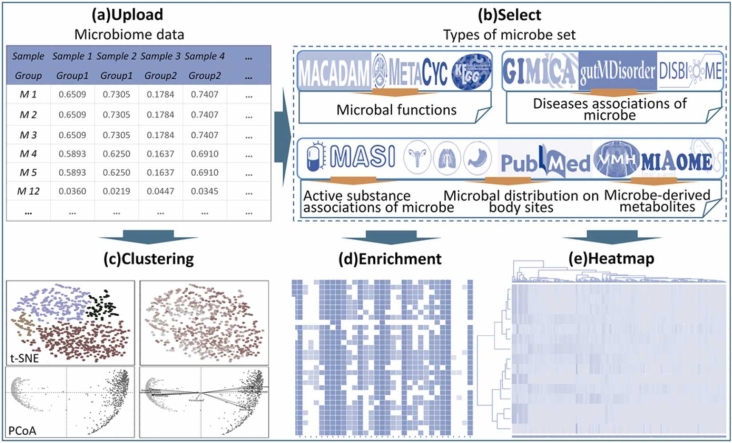
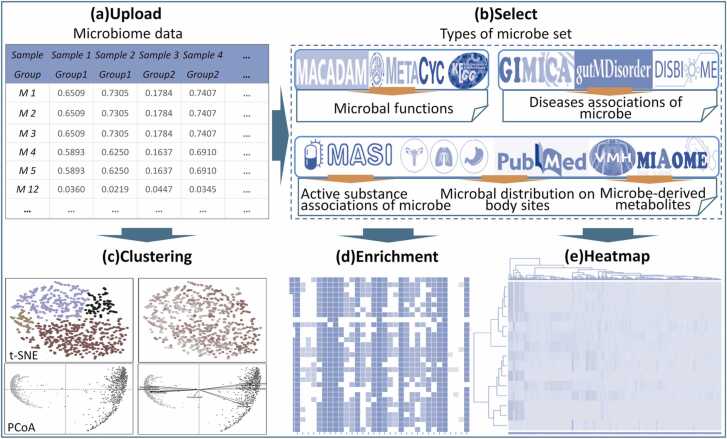
Microbial communities influence host phenotypes through microbiota-derived metabolites and interactions between exogenous active substances (EASs) and the microbiota. Owing to the high dynamics of microbial community composition and difficulty in microbial functional analysis, the identification of mechanistic links between individual microbes and host phenotypes is complex. Thus, it is important to characterize variations in microbial composition across various conditions (for example, topographical locations, times, physiological and pathological conditions, and populations of different ethnicities) in microbiome studies. However, no web server is currently available to facilitate such characterization. Moreover, accurately annotating the functions of microbes and investigating the possible factors that shape microbial function are critical for discovering links between microbes and host phenotypes. Herein, an online tool, CDEMI, is introduced to discover microbial composition variations across different conditions, and five types of microbe libraries are provided to comprehensively characterize the functionality of microbes from different perspectives. These collective microbe libraries include (1) microbial functional pathways, (2) disease associations with microbes, (3) EASs associations with microbes, (4) bioactive microbial metabolites, and (5) human body habitats. In summary, CDEMI is unique in that it can reveal microbial patterns in distributions/compositions across different conditions and facilitate biological interpretations based on diverse microbe libraries. CDEMI is accessible at http://rdblab.cn/cdemi/.

Keywords: Functional characterization; Metabolic pathway; Microbial association; Microbial composition; Microbiome.


Conflict of interest statement

The authors declare that they have no known competing financial interests or personal relationships that could have appeared to influence the work reported in this paper.

Figures

ga1
Graphical abstract
Fig. 1
Fig. 1
The standard workflow of CDEMI: (a) Uploading metagenomics/16S rRNA gene sequencing data (microbiome abundance table); (b) Selection of the types of microbe libraries; (c) Characterization and visualization of the differences in microbial compositions across various conditions; (d) Annotation and enrichment of microbes from different perspectives; (e) Heatmap of enrichment analysis of the microbe set across all microbial samples.
Fig. 2
Fig. 2
Differences in microbial community composition between the gut and nare. Sample data was from Snyder et al. . A. The relative abundance of the 15 dominant genera and others in the gut and nare microbiome regardless of healthy and prediabetes. The less abundant genera were grouped under "others". B. The relative abundance of the predominant microbes (top ten microbes) and others in the gut or nare. The less abundant microbes were grouped under "others". The relative abundance of dominant microbes was calculated using the mean relative abundance for each microbe of the gut and nare groups. C. The t-SNE plot of the gut and nare microbiome regardless of healthy and prediabetes. The colors represent the body sites (red: gut; blue: nare). D. The abundance distribution of representative microbes across all samples. The color key from light to dark indicates abundance levels from low to high. E. The differences in microbial community composition are shown by principal coordinates analysis (PCOA) of Bray-Curtis Distances, each symbol represents a sample. The color represents the body sites (red: gut; blue: nare). F. Biplot of PCoA with projected scores of major microbes which contributed to differences between the gut and nare sites.
Fig. 3
Fig. 3
Differences in microbial community composition between the LP and HC. Sample data was from Mande et al. . A. The relative abundance of the 5 dominant phyla and others in the LP and HC microbiome. The less abundant phyla were grouped under "others". B. The relative abundance of the predominant genera (top ten genera) and others in the LP or HC. The less abundant genera were grouped under "others". The relative abundance of dominant microbes was calculated using the mean relative abundance for each microbe of the LP and HC groups. C. The t-SNE plot of the LP and HC microbiome. The colors represent physiological conditions (yellow: HC; blue: LP). D. The abundance distribution of representative microbes across all samples. The color key from light to dark indicates abundance levels from low to high. LP: leprosy patients; HC: healthy controls.
Fig. 4
Fig. 4
The differences in microbial community composition between LP and HC groups at different geographical sampling locations. Sample data was from Mande et al. . A. The relative abundance of the 10 dominant phyla and others in the LP and HC. The less abundant phyla were grouped under "others". B. The relative abundance of the predominant genera (top fifteen genera) and others in the Hyd_HC, Mir_HC, Hyd_LP, and Mir_LP groups. The less abundant genera were grouped under "others". The relative abundance of dominant microbes was calculated using the mean relative abundance for each microbe of the LP and HC groups. C. The t-SNE plot of the skin swab microbiome from Hyd_HC, Mir_HC, Hyd_LP, and Mir_LP groups. The colors represent geographical sampling locations under LP and HC conditions (red: Hyd_HC; blue: Hyd_LP; green: Mir_HC; purple: Mir_LP). D. The abundance distribution of representative microbes across all samples. The color key from light to dark indicates abundance levels from low to high. Hyd: Hyderabad; Mir: Miraj, LP: leprosy patients; HC: healthy controls.
Fig. 5
Fig. 5
Microbial annotation and enrichment analysis based on differentially abundant OTUs between the DR and HC. Sample data was from Shivaji et al. . A. Volcano plot of differentially abundant OTUs between the DR and HC (|logFC|>0.585, p-value<0.05), eOTUs: enriched OTUs, dOTUs: depleted OTUs, oOTUs: ordinary OTUs. B. LDA scores of the differentially abundant OTUs between the DR and HC. LDA scores were generated from the LEfSe analysis (LDA> 2.0, p-value<0.05). One bacterial OTU was enriched in HC and 6 OTUs were enriched in DR. C. Functional enrichment analysis results were based on the microbial function library in the CDEMI. Colors represent the counts of microbes involved in this pathway. D. Microbe-derived metabolite enrichment analysis results. Colors represent the counts of microbes associated with this metabolite. BCAA transport system: Branched-chain amino acid transport system; Hydroxypropionate/butylate cycle: Hydroxypropionate-hydroxybutylate cycle; GABA shunt: GABA (gamma-Aminobutyrate) shunt; LPS: Lipopolysaccharide; Glucitol/sorbitol-specific PTS system: PTS system, glucitol/sorbitol-specific II component; Ascorbate-specific PTS system: PTS system, ascorbate-specific II component; DR: diabetic retinopathy; HC: healthy controls.
Fig. 6
Fig. 6
Microbial annotation and enrichment analysis based on differentially abundant OTUs between the pre-amoxicillin and post-amoxicillin groups. Sample data from Schrenzel et al. . A. Volcano plot of differentially abundant OTUs between the pre-amoxicillin and post-amoxicillin groups (|logFC|>0.585 and p-value<0.05), eOTUs: enriched OTUs, dOTUs: depleted OTUs, oOTUs: ordinary OTUs. B. LDA scores of the differentially abundant OTUs between the pre-amoxicillin and post-amoxicillin groups. LDA scores were generated from the LEfSe analysis (LDA> 2.0, p-value<0.05). 12 OTUs were enriched in the pre-amoxicillin group and 7 were enriched in the post-amoxicillin group. C. EASs enrichment analysis results based on microbe-associated EASs library in CDEMI. Colors represented the counts of microbes involved in EASs.

Similar articles

References

    1. Ranallo R.T., McDonald L.C., Halpin A.L., Hiltke T., Young V.B. The state of microbiome science at the intersection of infectious diseases and antimicrobial resistance. J Infect Dis. 2021;223:S187–S193. doi: 10.1093/infdis/jiab020. - DOI - PMC - PubMed
    1. Han S., Van Treuren W., Fischer C.R., Merrill B.D., DeFelice B.C., et al. A metabolomics pipeline for the mechanistic interrogation of the gut microbiome. Nature. 2021;595:415–420. doi: 10.1038/s41586-021-03707-9. - DOI - PMC - PubMed
    1. Shine E.E., Crawford J.M. Molecules from the microbiome. Annu Rev Biochem. 2021;90:789–815. doi: 10.1146/annurev-biochem-080320-115307. - DOI - PubMed
    1. Funabashi M., Grove T.L., Wang M., Varma Y., McFadden M.E., et al. A metabolic pathway for bile acid dehydroxylation by the gut microbiome. Nature. 2020;582:566–570. doi: 10.1038/s41586-020-2396-4. - DOI - PMC - PubMed
    1. Krautkramer K.A., Fan J., Backhed F. Gut microbial metabolites as multi-kingdom intermediates. Nat Rev Microbiol. 2021;19:77–94. doi: 10.1038/s41579-020-0438-4. - DOI - PubMed