[Preprint]. 2023 Apr 13:rs.3.rs-2791107.
doi: 10.21203/rs.3.rs-2791107/v1.

Gut microbiota and fecal short chain fatty acids differ with adiposity and country of origin: The METS-Microbiome Study

Affiliations

Gut microbiota and fecal short chain fatty acids differ with adiposity and country of origin: The METS-Microbiome Study

Jack Gilbert et al. Res Sq. .

Update in

Abstract

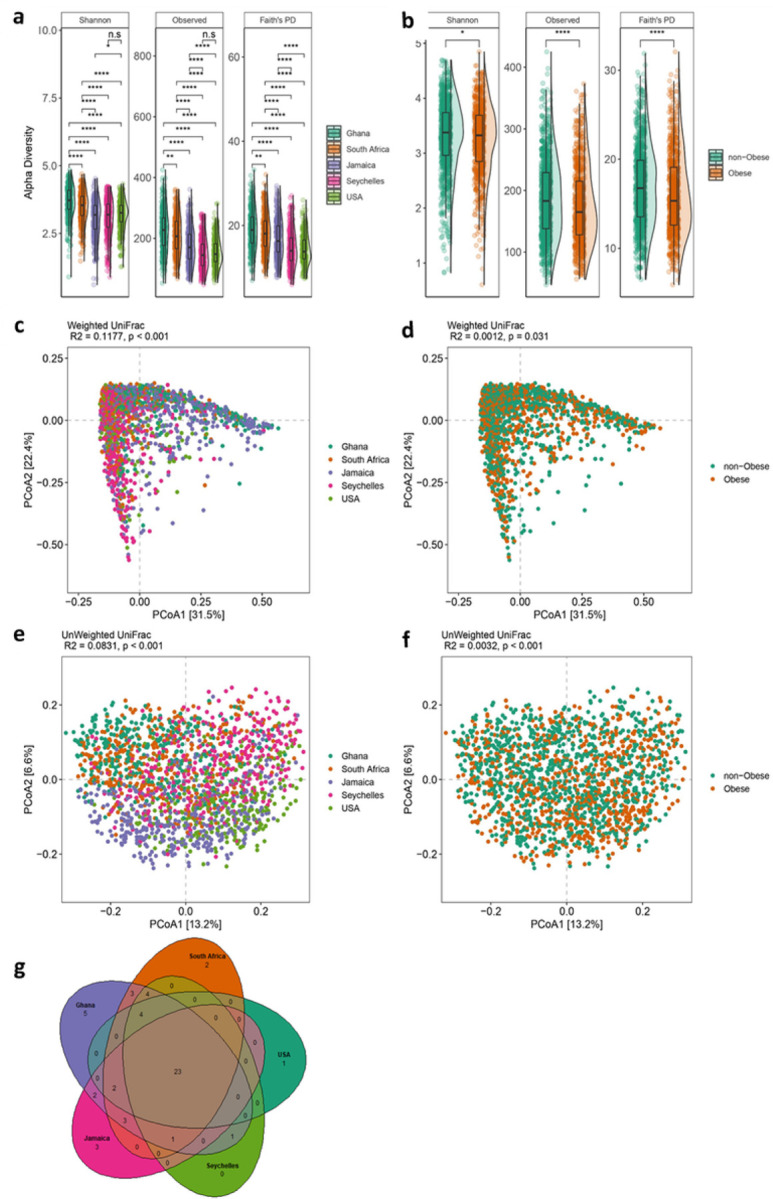
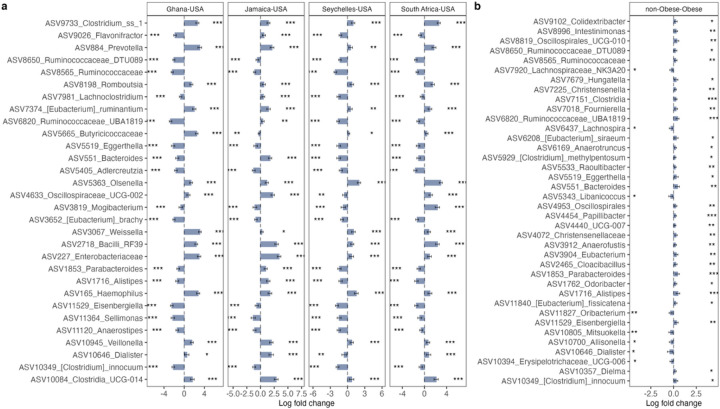
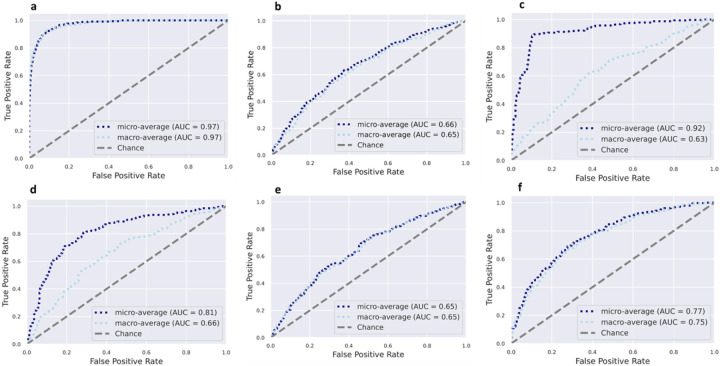
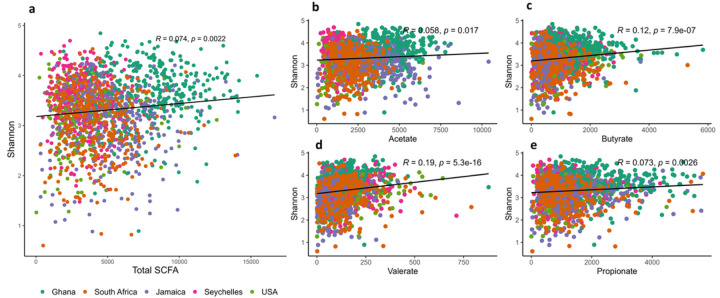
The relationship between gut microbiota, short chain fatty acid (SCFA) metabolism, and obesity is still not well understood. Here we investigated these associations in a large (n=1904) African origin cohort from Ghana, South Africa, Jamaica, Seychelles, and the US. Fecal microbiota diversity and SCFA concentration were greatest in Ghanaians, and lowest in the US population, representing the lowest and highest end of the epidemiologic transition spectrum, respectively. Obesity was significantly associated with a reduction in SCFA concentration, microbial diversity and SCFA synthesizing bacteria. Country of origin could be accurately predicted from the fecal microbiota (AUC=0.97), while the predictive accuracy for obesity was inversely correlated to the epidemiological transition, being greatest in Ghana (AUC = 0.57). The findings suggest that the microbiota differences between obesity and non-obesity may be larger in low-to-middle-income countries compared to high-income countries. Further investigation is needed to determine the factors driving this association. .


Figures

Figure 1
Figure 1. Variation in gut microbiome diversity.
(a)Alpha diversity estimated by Shannon, Observed ASVs and Faith’s PD (Phylogenetic Diversity) between countries. (b) Alpha diversity estimated by Shannon, Observed ASVs and Faith’s PD (Phylogenetic Diversity) between obese and non-obese. Alpha diversity metrics (Faith’s PD, Observed ASVs and Shannon) are shown on the y-axis in different panels, while country or obese group are shown on the x-axis. (c) Beta diversity principal coordinate analysis based on weighted UniFrac distance between countries. (d) Beta diversity principal coordinate analysis based on weighted UniFrac distance between obese and non-obese. (e) Beta diversity principal coordinate analysis based on unweighted UniFrac distance between countries. (f) Beta diversity principal coordinate analysis based on unweighted UniFrac distance between obese and non-obese. Proportion of variance explained by each principal coordinate axis is denoted in the corresponding axis label. (g) Venn diagram of shared and unique ASVs between the five countries. Box plots show the interquartile range (IQR), the horizontal lines show the median values, and the whiskers extend from the hinge no further than 1.5*IQR. Each colored dot denotes a sample. Statistical significance adjusted for multiple comparisons using false discovery rate (FDR) correction are indicated: *, P < 0.05; **, P < 0.01; ***, P < 0.001; ∗∗∗, P < 0.001 across countries and obese groups (Kruskal-Wallis test) for alpha diversity or by permutational multivariate analysis of variance (PERMANOVA) for beta diversity. Alpha diversity analysis for country, n=1873 samples (Ghana, n= 373; South Africa, n=390; Jamaica, n= 401; Seychelles, n= 396; USA, n= 313) and obesity status, n=1764 samples. For Beta diversity analysis, n=1764 samples.
Figure 2
Figure 2. Variation in gut microbiome composition.
Differentially abundant taxa among (a) countries and (b) obese group adjusted for BMI, age, sex and country using ANCOM-BC. Bars represent ANCOM-BC estimated log fold change between compared groups and error bars, with the 95% confidence interval. Representative ASVs with log fold change >1.4 in at least one group are shown for country. FDR-adjusted (p < 0.05) effect sizes are indicated by *, ** and ***, corresponding to p < 0.05, <0.01 and <0.001 respectively. n= 1694 samples. FDR= False Discovery Rate.
Figure 3
Figure 3. Receiver operating characteristic curves showing the classification accuracy of gut microbiota in a Random Forest model.
Classification accuracy for estimating (a). All countries (n=1694); (b) Obesity status (n=1694), (c). Diabetes status (n=1657); (d). Glucose status (n=1657); (e). Hypertensive status (1694); (f). Sex (n=1694) are presented. AUC= area under the curve
Figure 4
Figure 4. Shannon index correlates positively with fecal short chain fatty acids.
Correlations between Shannon diversity (n = 1764) and concentrations (n=1704) of the different types of fecal short chain fatty acids (SCFAs) namely (a) total SCFA; (b) Acetate; (c) Butyrate; (d) Propionate; (e) Valerate among countries. Each colored dot represents a sample of specific country and the horizontal line on scatterplot denotes line of best t.
Figure 5
Figure 5. Associations of gut microbiota ASVs with concentrations of short chain fatty acids (SCFAs).
(a) Heatmap of Spearman’s correlation between concentrations of SCFAs (n=) and top 30 differentially abundant ASVs (identified by ANCOM-BC) among countries. (b) Heatmap of Spearman’s correlation between concentrations of SCFAs and differentially abundant ASVs (identified by ANCOM-BC) for obese. Correlations are identified by Spearman’s rank correlation coefficient. Brick red squares indicate positive correlation, gray squares represent negative correlation and white squares are insignificant correlation. Mapping from FDR adjusted p values are denoted as: *, ** and ***, corresponding to p < 0.05, <0.01 and <0.001 respectively.

References

    1. Abdelaal Mahmoud, le Roux Carel W., and Docherty Neil G.. 2017. “Morbidity and Mortality Associated with Obesity.” Annals of Translational Medicine 5 (7): 161. - PMC - PubMed
    1. Agyemang Charles, Boatemaa Sandra, Frempong Grace Agyemang, and de-Graft Aikins Ama. 2016. “Obesity in Sub-Saharan Africa.” In Metabolic Syndrome: A Comprehensive Textbook,edited by Ahima Rexford S, 41–53. Cham: Springer International Publishing.
    1. Ajala O., Mold F., Boughton C., Cooke D., and Whyte M.. 2017. “Childhood Predictors of Cardiovascular Disease in Adulthood. A Systematic Review and Meta-Analysis.” Obesity Reviews: An Official Journal of the International Association for the Study of Obesity 18 (9): 1061–70. - PubMed
    1. Amir Amnon, Daniel McDonald Jose A. Navas-Molina, Kopylova Evguenia, Morton James T., Zhenjiang Zech Xu Eric P. Kightley, et al. 2017. “Deblur Rapidly Resolves Single-Nucleotide Community Sequence Patterns.” MSystems 2 (2). 10.1128/mSystems.00191-16. - DOI - PMC - PubMed
    1. Arumugam Manimozhiyan, Raes Jeroen, Pelletier Eric, Denis Le Paslier Takuji Yamada, Mende Daniel R., Fernandes Gabriel R., et al. 2011. “Enterotypes of the Human Gut Microbiome.” Nature 473 (7346): 174–80. - PMC - PubMed

Publication types

LinkOut - more resources