[Preprint]. 2023 Apr 14:rs.3.rs-2801767.
doi: 10.21203/rs.3.rs-2801767/v1.

Utilizing river and wastewater as a SARS-CoV-2 surveillance tool to predict trends and identify variants of concern in settings with limited formal sewage systems

Affiliations

Utilizing river and wastewater as a SARS-CoV-2 surveillance tool to predict trends and identify variants of concern in settings with limited formal sewage systems

Kayla Barnes et al. Res Sq. .

Update in

Abstract

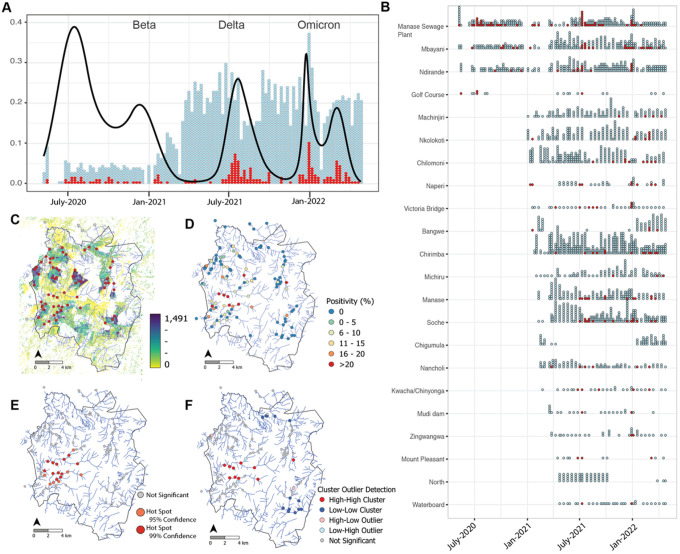
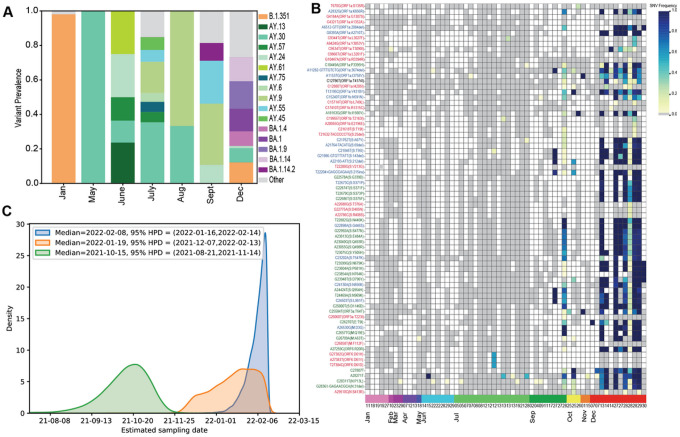
The COVID-19 pandemic continues to impact health systems globally and robust surveillance is critical for pandemic control, however not all countries can sustain community surveillance programs. Wastewater surveillance has proven valuable in high-income settings, but little is known about how river and informal sewage in low-income countries can be used for environmental surveillance of SARS-CoV-2. In Malawi, a country with limited community-based COVID-19 testing capacity, we explored the utility of rivers and wastewater for SARS-CoV-2 surveillance. From May 2020 - January 2022, we collected water from up to 112 river or informal sewage sites/month, detecting SARS-CoV-2 in 8.3% of samples. Peak SARS-CoV-2 detection in water samples predated peaks in clinical cases. Sequencing of water samples identified the Beta, Delta, and Omicron variants, with Delta and Omicron detected well in advance of detection in patients. Our work highlights wastewater can be used for detecting emerging waves, identifying variants of concern and function as an early warning system in settings with no formal sewage systems.


Figures

Figure 1
Figure 1. Temporal ES sampling in Blantyre Malawi.
A) sampling overtime where each individual dot is one sample tested either negative (blue) or positive (red) for SARS-CoV-2. The y-axis and black line are the Spline curve modeling peaks and valleys in detection based on the frequenting of positivity. B) The region-specific dot plot shows 22 areas of Blantyre sampled during phase 1 (2020) and/or phase 2 (2021–2022) by negative (blue) or positive (red) for SARS-CoV-2. This also shows there was over sampling and under sampling of some regions of the city and regions with higher SARS-CoV-2 detection. C) Red dots denote sites with at least one positive sample overlaid on the population density of Blantyre based on HRSL data. D) each sampling location is color coded by the overall percent positivity based on the full collection. E) Hotspot analysis using Getis-Ord Gi* and F) spatial cluster-outlier detection analysis using Anselin Local Moran’s I. Utilizing this analysis sites can be reduced for future collections to less than 20 sites.
Figure 2
Figure 2. Estimates of lag time between ES and active case surveillance.
Light blue represents the rolling average of ES positivity over time compared to active case surveillance numbers (bar graph in light orange) where the y-axis is total on number of positive cases per day. Spline comparison of both ES (dark blue) and active case surveillance prevalence (dark orange) show how closely linked peaks in both detection methods are over multiple waves.
Figure 3
Figure 3. SARS-CoV-2 variant in wastewater identified key VOCs before observed in the patient population.
A) Summary of VOC detected by month using Freyja, B) Omicron SNPs show putative early detection of the VOC. The heatmap shows all Omicron SNPs on the y-axis (blue=BA.1-specific, red=BA.2-specific, green=BA.1/2 shared mutation) and individual ES samples overtime on the x-axis where months are by color. In September (samples have some key Omicron SNPs but lack the full repertoire of SNPs which become dominant by December. C) Time-calibrated Bayesian phylogenetic analysis of the early Omicron samples under three considerations: genome assembly with only physically linked mutations (green), genome assembly with the inclusion of the frequency-linked BA.14 mutation (orange) and only high frequency mutations (blue). This analysis showed higher confidence in the mid-January genome.

References

    1. Harvey W. T. et al. SARS-CoV-2 variants, spike mutations and immune escape. Nat Rev Microbiol 19, 409–424, doi: 10.1038/s41579-021-00573-0 (2021). - DOI - PMC - PubMed
    1. Choi A. et al. Safety and immunogenicity of SARS-CoV-2 variant mRNA vaccine boosters in healthy adults: an interim analysis. Nat Med 27, 2025–2031, doi: 10.1038/s41591-021-01527-y (2021). - DOI - PMC - PubMed
    1. Gandon S. & Lion S. Targeted vaccination and the speed of SARS-CoV-2 adaptation. Proc Natl Acad Sci U S A 119, doi: 10.1073/pnas.2110666119 (2022). - DOI - PMC - PubMed
    1. Chibwana M. G. et al. High SARS-CoV-2 seroprevalence in health care workers but relatively low numbers of deaths in urban Malawi. medRxiv, doi: 10.1101/2020.07.30.20164970 (2020). - DOI
    1. Mandolo J. et al. SARS-CoV-2 exposure in Malawian blood donors: an analysis of seroprevalence and variant dynamics between January 2020 and July 2021. BMC Med 19, 303, doi: 10.1186/s12916-021-02187-y (2021). - DOI - PMC - PubMed

Publication types

LinkOut - more resources