[Preprint]. 2023 Apr 13:2023.04.12.536558.
doi: 10.1101/2023.04.12.536558.

FGF-21 Conducts a Liver-Brain-Kidney Axis to Promote Renal Cell Carcinoma

Affiliations

FGF-21 Conducts a Liver-Brain-Kidney Axis to Promote Renal Cell Carcinoma

Zongyu Li et al. bioRxiv. .

Abstract

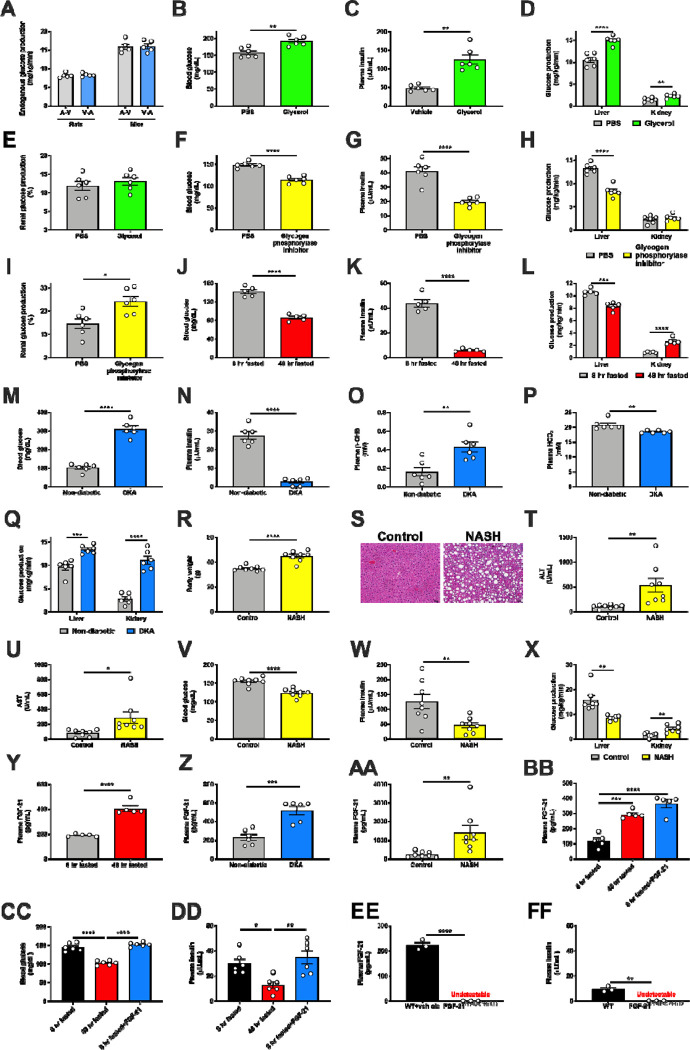
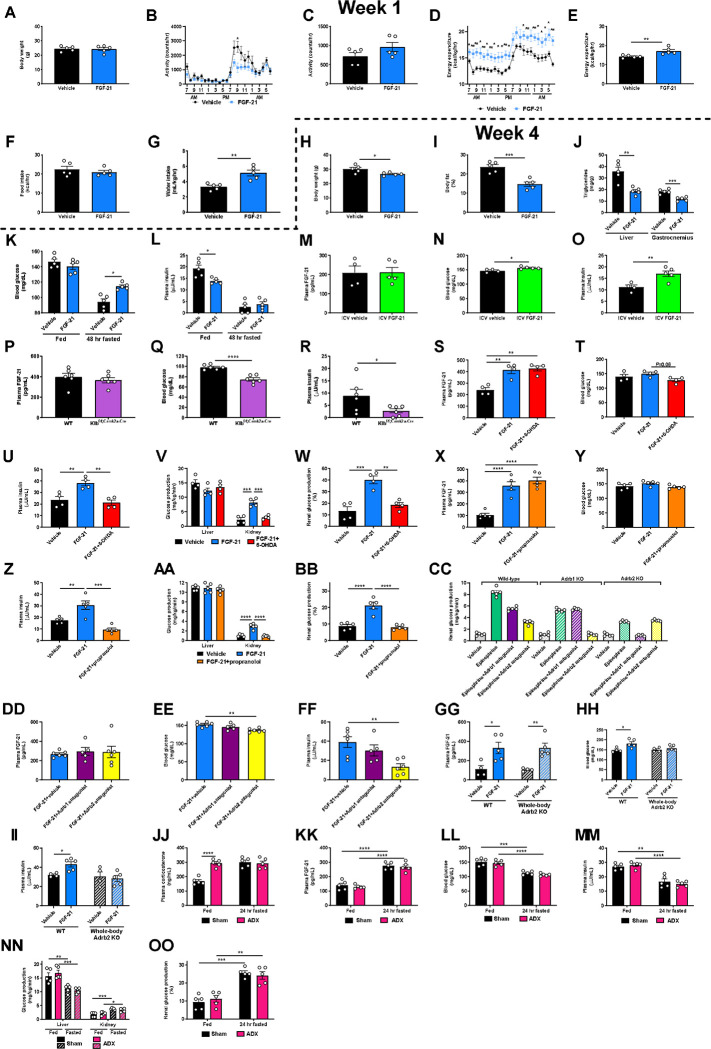
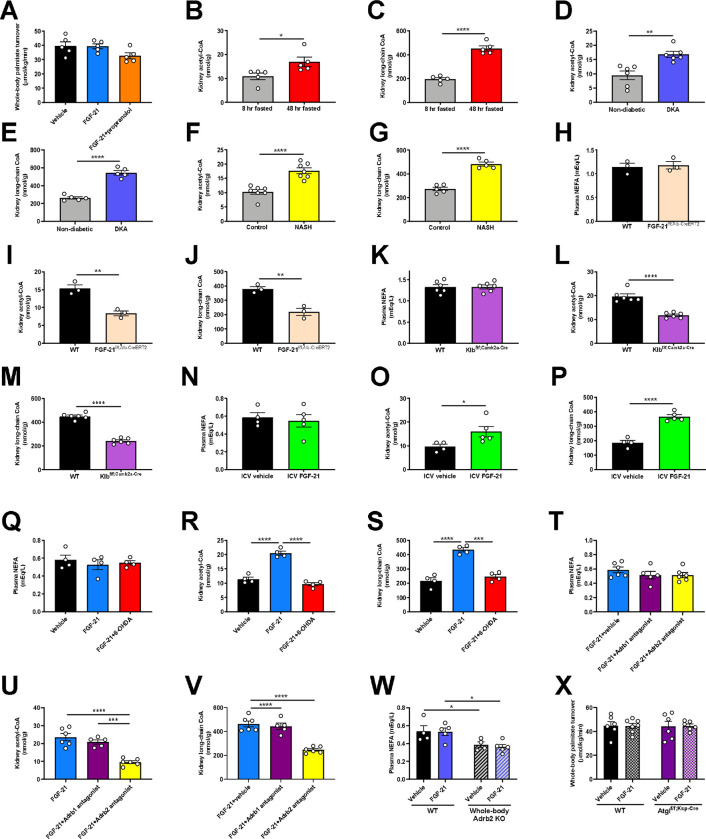
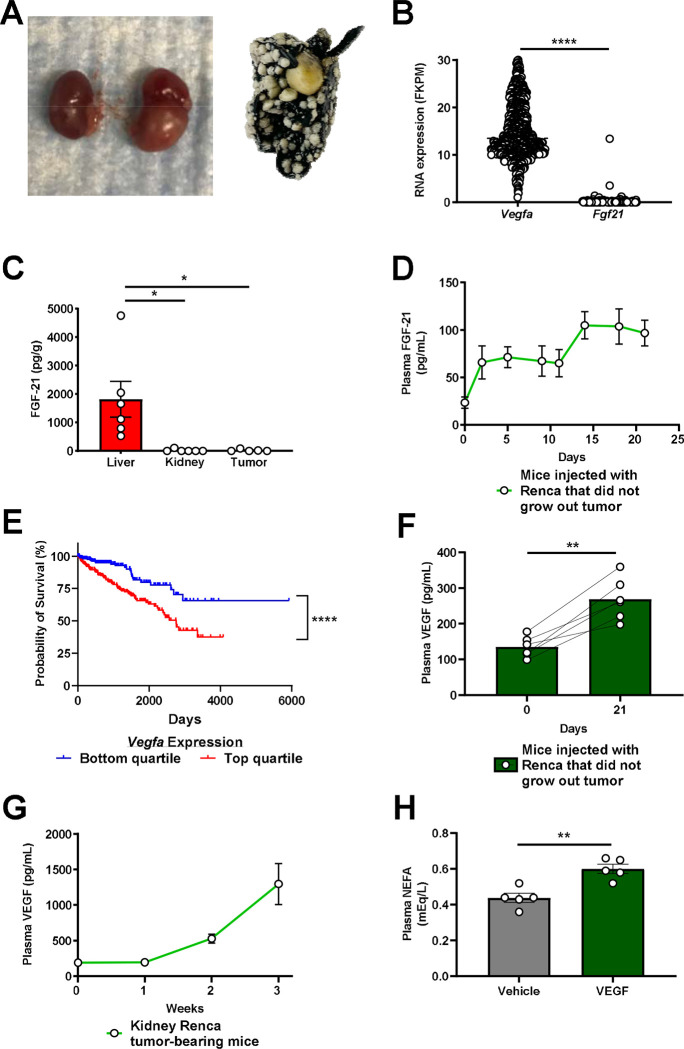
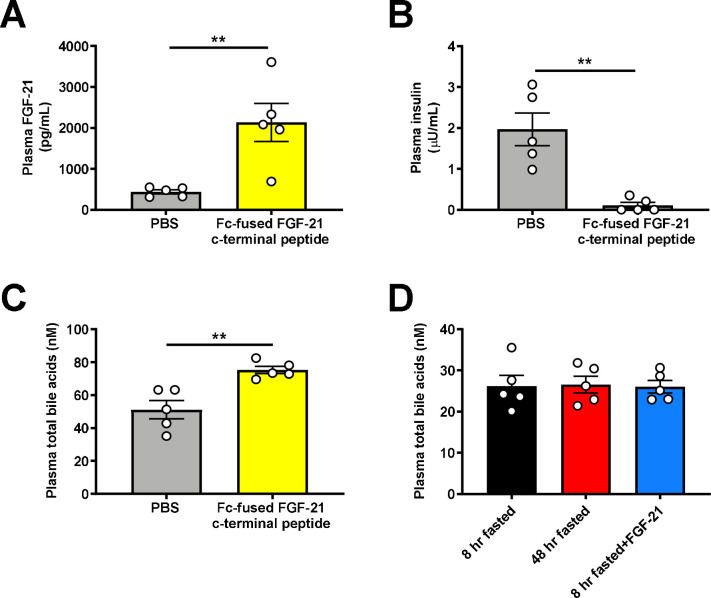
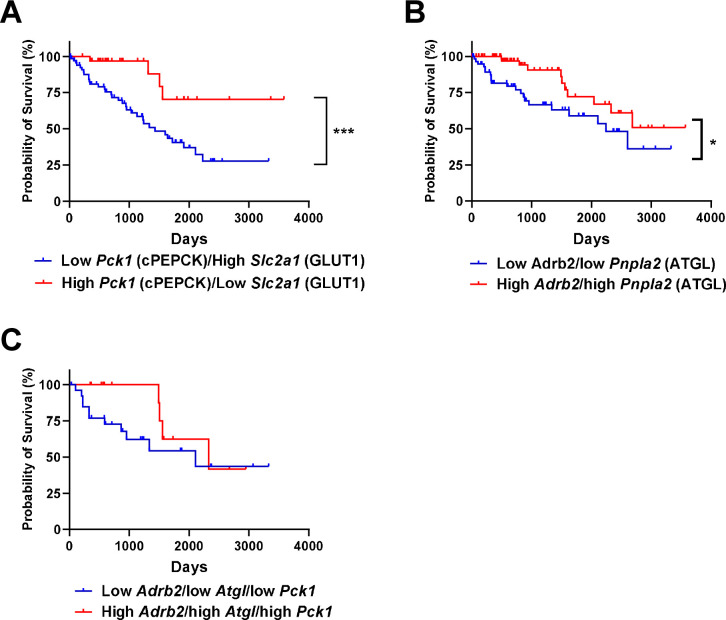
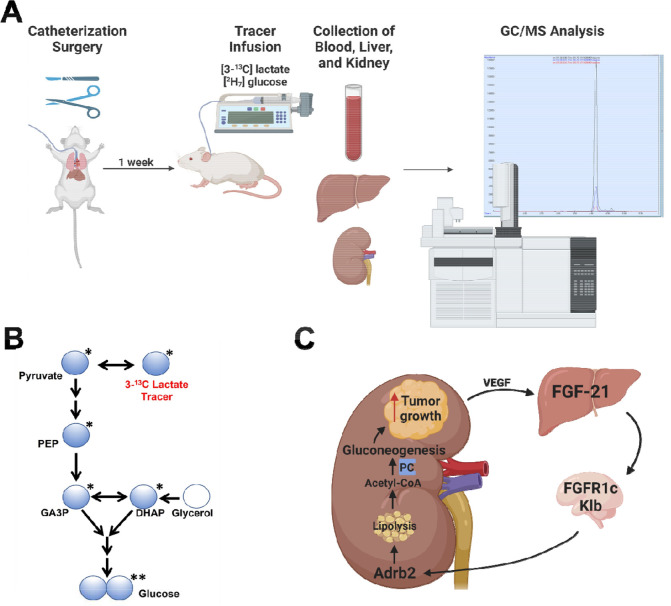
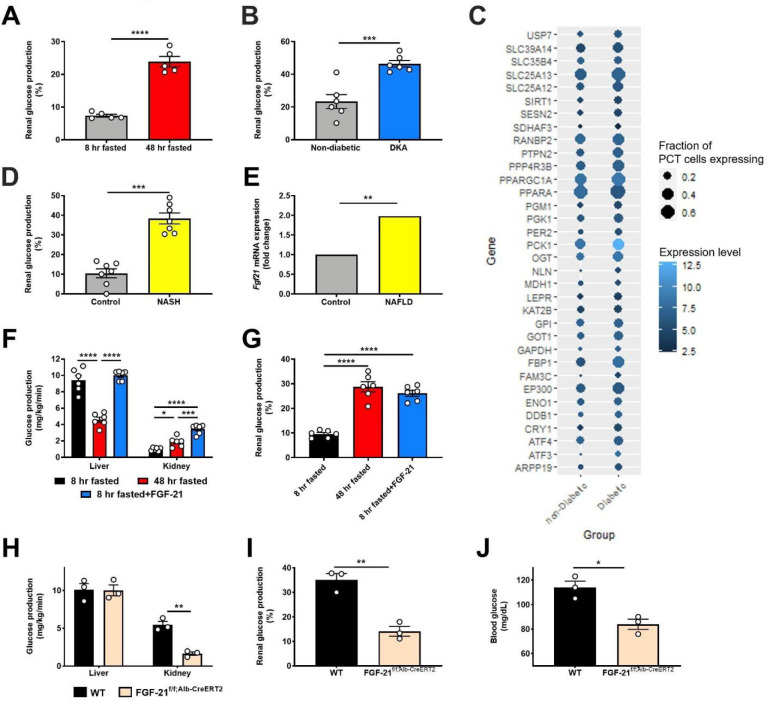
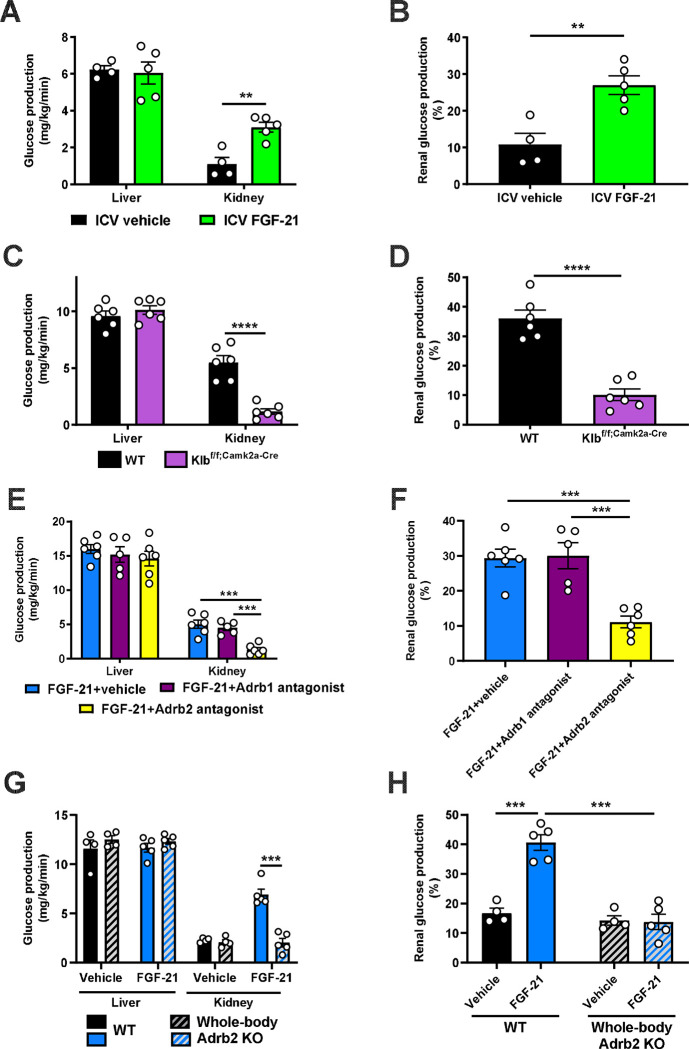
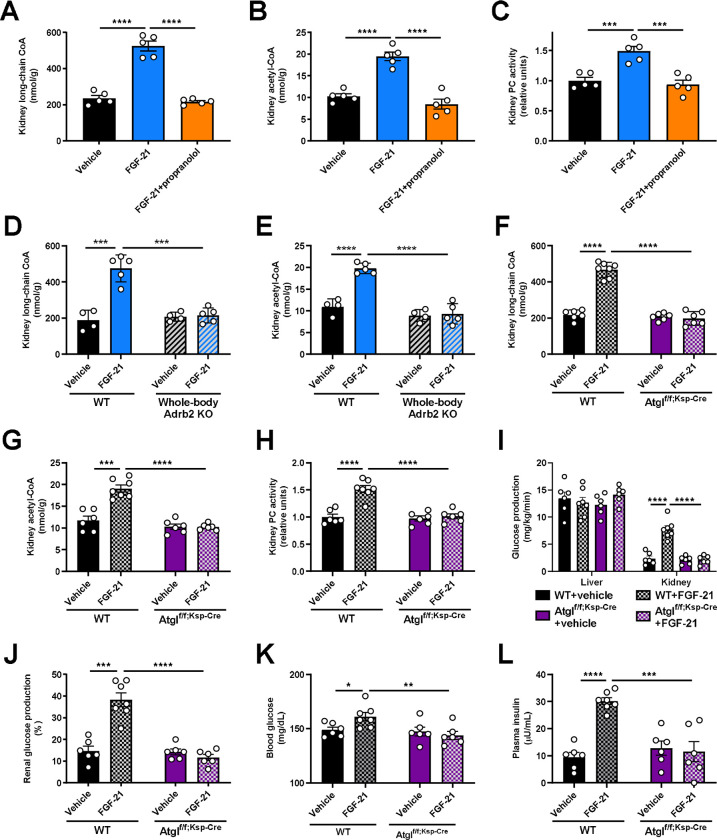
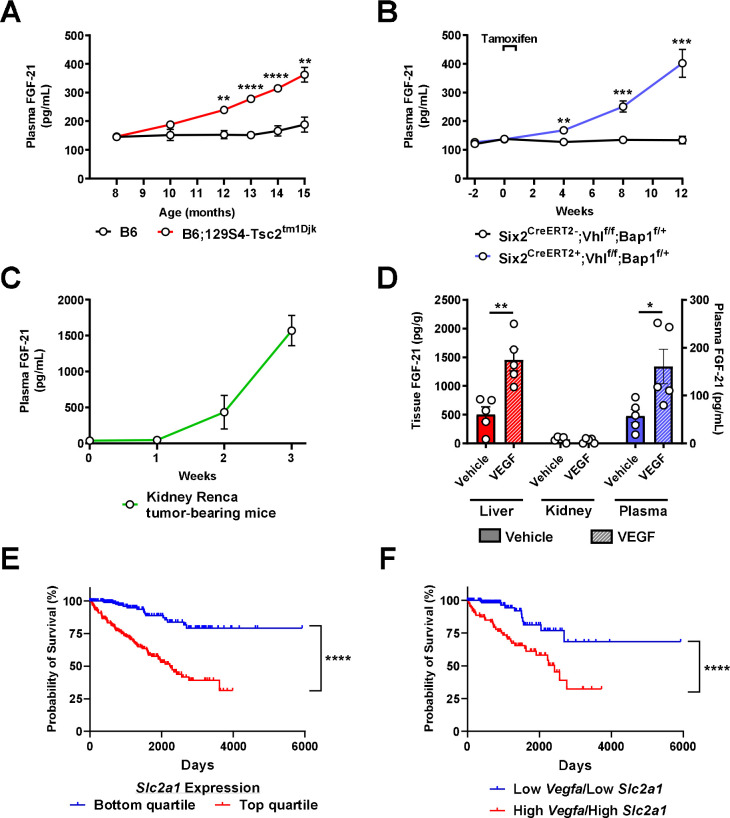
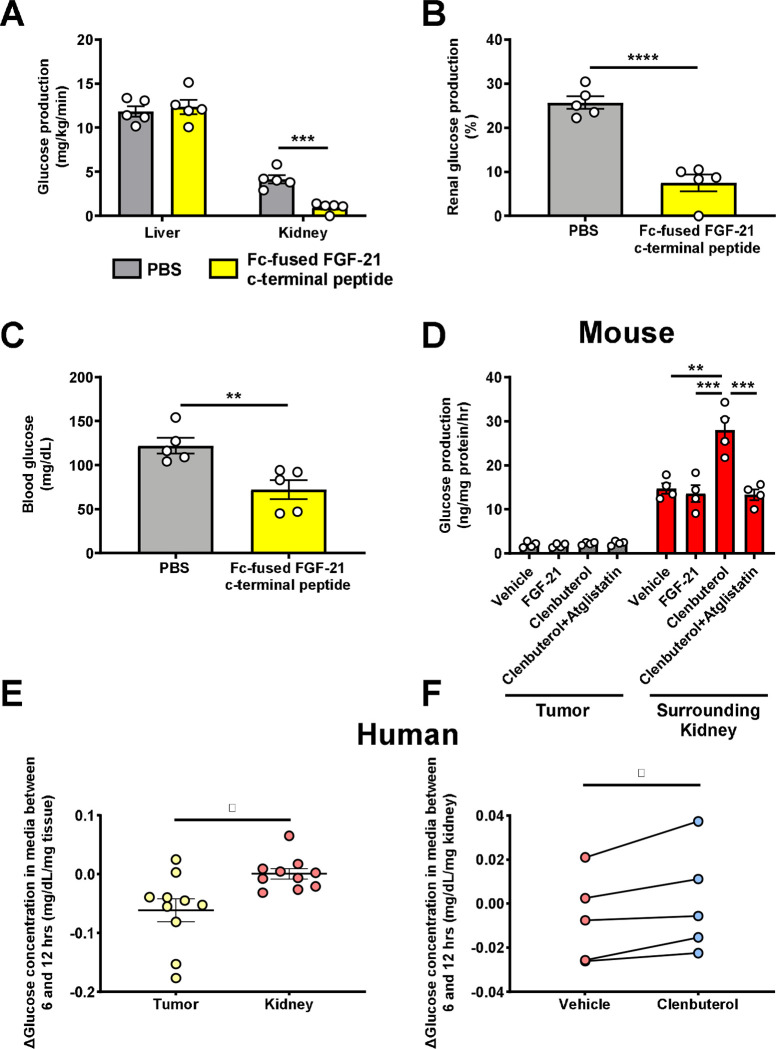
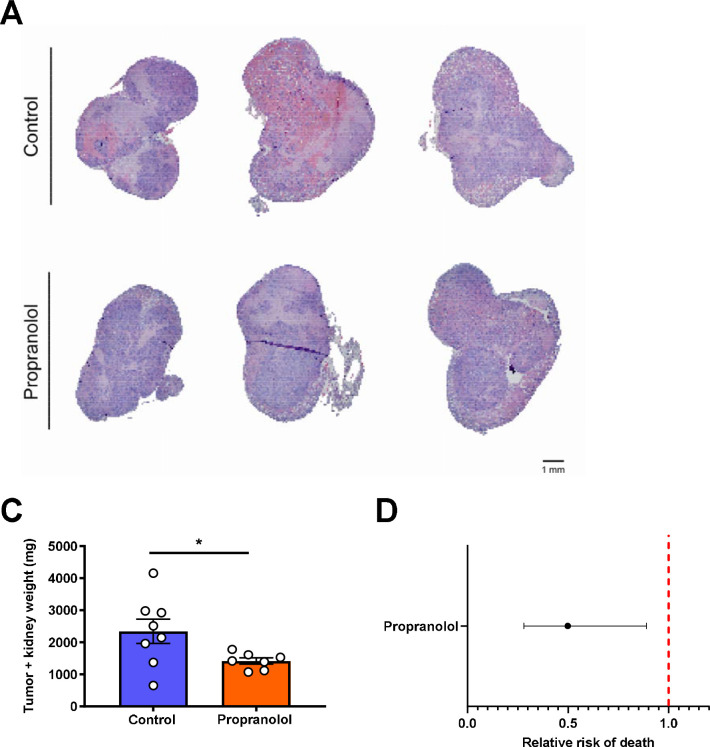
Metabolic homeostasis is one of the most exquisitely tuned systems in mammalian physiology. Metabolic homeostasis requires multiple redundant systems to cooperate to maintain blood glucose concentrations in a narrow range, despite a multitude of physiological and pathophysiological pressures. Cancer is one of the canonical pathophysiological settings in which metabolism plays a key role. In this study, we utilized REnal Gluconeogenesis Analytical Leads (REGAL), a liquid chromatography-mass spectrometry/mass spectrometry-based stable isotope tracer method that we developed to show that in conditions of metabolic stress, the fasting hepatokine fibroblast growth factor-21 (FGF-21)1,2 coordinates a liver-brain-kidney axis to promote renal gluconeogenesis. FGF-21 promotes renal gluconeogenesis by enhancing β2 adrenergic receptor (Adrb2)-driven, adipose triglyceride lipase (ATGL)-mediated intrarenal lipolysis. Further, we show that this liver-brain-kidney axis promotes gluconeogenesis in the renal parenchyma in mice and humans with renal cell carcinoma (RCC). This increased gluconeogenesis is, in turn, associated with accelerated RCC progression. We identify Adrb2 blockade as a new class of therapy for RCC in mice, with confirmatory data in human patients. In summary, these data reveal a new metabolic function of FGF-21 in driving renal gluconeogenesis, and demonstrate that inhibition of renal gluconeogenesis by FGF-21 antagonism deserves attention as a new therapeutic approach to RCC.


Conflict of interest statement

Competing Interests Declaration The authors declare no competing interests.

Figures

Extended Data Figure 1.
Extended Data Figure 1.. FGF-21 promotes renal gluconeogenesis under conditions of metabolic stress.
(A) Measured endogenous glucose production is identical in rats and mice whether tracer is infused into the carotid artery and blood drawn from the jugular vein (A-V), or tracer is infused into the jugular vein and blood drawn from the carotid artery (V-A) (n=5 per group). (B)-(C) Blood glucose and plasma insulin concentrations in 6 hr fasted mice infused with glycerol, a gluconeogenic substrate (n=6 per group). (D)-(E) Hepatic and renal glucose production (n=6 per group). (F)-(G) Blood glucose and plasma insulin in 6 hr fasted mice treated with a glycogen phosphorylase antagonist to inhibit glycogenolysis (n=6 per group). (H)-(I) Hepatic and renal glucose production (n=6 per group). (J)-(K) Blood glucose and plasma insulin in recently fed (8 hr fasted) and starved (48 hr fasted) mice (n=5 per group). (L) Hepatic and renal glucose production (n=5 per group). (M)-(P) Blood glucose, plasma insulin, β-OHB, and bicarbonate in a mouse model of diabetic ketoacidosis (n=6 per group). (Q) Hepatic and renal glucose production (n=6 per group). (R)-(S) Body weight and liver hematoxylin & eosin staining in a mouse model of NASH (n=8 per group). Scale bar, 100 μm. (T)-(U) Liver transaminase concentrations (n=8 per group). (V)-(W) Blood glucose and plasma insulin (n=8 per group). (X) Hepatic and renal glucose production (n=7 per group). (Y)-(AA) Plasma FGF-21 concentrations in fed/fasted (n=5 per group), DKA (n=6 per group), and NASH models (n=8 per group). (BB)-(DD) Plasma FGF-21 (n=5 per group), blood glucose (n=6 per group), and plasma insulin concentrations (n=6 per group) in recently fed, fasted, and FGF-21 infused rats. *P<0.05, **P<0.01, ***P<0.001, ****P<0.0001 by ANOVA with Tukey’s multiple comparisons test. (EE)-(FF) Plasma FGF-21 and insulin concentrations in FGF-21f/f;Alb-CreERT2 mice and their WT littermates fasted for 48 hr (n=3 per group). In all panels, *P<0.05, **P<0.01, ***P<0.001, ****P<0.0001 by the 2-tailed unpaired Student’s t-test.
Extended Data Figure 2.
Extended Data Figure 2.. FGF-21 promotes renal gluconeogenesis via Adrb2-dependent neural hardwiring.
Consistent with previous reports, we find that chronic FGF-21 infusion increases energy expenditure and improves metabolic health in diet-induced obese mice. (A)-(G) Body weight, activity, energy expenditure, food and water intake during the first week of FGF-21 or vehicle infusion. Throughout this figure, unless otherwise specified, groups were compared by the 2-tailed unpaired Student’s t-test. In panels (A)-(L), n=5 per group. (H)-(L) Body weight and fat, tissue triglyceride content, blood glucose, and plasma insulin concentrations in week 4 of FGF-21 infusion. (M) Jugular vein plasma FGF-21 concentrations in rats infused with FGF-21 into the third ventricle (ICV) (n=4 vehicle-treated and 5 FGF-21-treated rats in panels (M)-(O)). (N)-(O) Blood glucose and plasma insulin. (P)-(R) Plasma FGF-21, blood glucose, and plasma insulin concentrations in WT and Klbf/f;Camk2a-Cre mice (n=6 per group). (S)-(U) Plasma FGF-21, blood glucose, and plasma insulin concentrations in FGF-21 infused mice, chemically sympathectomized with 6-OHDA (n=4 per group). In panels (S)-(FF), groups were compared by ANOVA with Tukey’s multiple comparisons test. (V)-(W) Hepatic and renal glucose production (n=4 per group). (X)-(Z) Plasma FGF-21, blood glucose, and plasma insulin concentrations in mice infused with FGF-21 and treated with the nonselective Adrb antagonist propranolol (n=5 per group). (AA)-(BB) Hepatic and renal glucose production (n=5 per group). (CC) Validation of Adrb1 and Adrb2 antagonists: epinephrine-stimulated renal glucose production (n=5 per group). For clarity of presentation, statistical comparisons were not performed. (DD) Plasma FGF-21 concentrations in FGF-21 infused mice treated with antagonists of Adrb1 (betaxolol) or Adrb2 (butoxamine) (in panels (DD)-(FF), n=6 [vehicle and Adrb2 antagonist-treated] or 5 per group [Adrb1 antagonist-treated]). (EE) Blood glucose. (FF) Plasma insulin concentrations. (GG) Plasma FGF-21 concentrations in vehicle- and FGF-21-infused WT and whole-body Adrb2 KO littermates (in panels (GG)-(II), n=4 (vehicle-treated) or 5 (FGF-21-treated) per group. (HH)-(II) Blood glucose and plasma insulin concentrations. (JJ) Plasma corticosterone in sham-operated and adrenalectomized mice. ADX mice were implanted with a subcutaneous pump to deliver corticosterone to match concentrations in 24 hr fasted mice, in order to avoid corticosterone as a potential phenotypic confounder. (KK) Plasma FGF-21. (LL)-(MM) Hepatic and renal glucose production. (NN)-(OO) Blood glucose and plasma insulin concentrations. In panels (JJ)-(OO), n=5 per group, and fed vs. 24 hr fasted and sham vs. ADX mice were compared by the 2-tailed unpaired Student’s t-test. In all panels, *P<0.05, **P<0.01, ***P<0.001, ****P<0.0001.
Extended Data Figure 3.
Extended Data Figure 3.. FGF-21-induced increases in renal lipolysis promote increased renal gluconeogenesis in metabolic stress.
(A) Whole-body lipolysis (palmitate turnover) in mice infused with FGF-21±pretreatment with propranolol. In panels (A), (Q)-(V), groups were compared by ANOVA with Tukey’s multiple comparisons test. In panels (A)-(C), n=5 per group. (B)-(C) Kidney acetyl- and long-chain acyl-CoA concentrations in fed/fasted mice. (D)-(E) Kidney acetyl- and long-chain acyl-CoA concentrations in mice in DKA (n=6 per group). (F)-(G) Kidney acetyl- and long-chain acyl-CoA concentrations in a mouse model of NASH (n=8 per group). (H) Plasma non-esterified fatty acid concentrations in 24 hr fasted FGF-21f/f;Alb-CreERT2 mice (i.e. liver-specific FGF-21 knockout) (n=3 per group). (I)-(J) Kidney acetyl- and long-chain acyl-CoA concentrations. (K) Plasma NEFA in Klbf/f;Camk2a-Cre mice (i.e. brain-specific Klb knockout). In panels (K)-(M), n=5 per group. (L)-(M) Kidney acetyl- and long-chain acyl-CoA concentrations (n=5 per group). (N) Plasma NEFA in ICV FGF-21 infused rats. In panels (N)-(P), n=4 vehicle-treated and 5 FGF-21-treated rats per group. (O)-(P) Kidney acetyl- and long-chain acyl-CoA concentrations. (Q) Plasma NEFA in vehicle and FGF-21-infused mice, some pre-treated with chemical sympathectomy via 6-OHDA (in panels (Q)-(S), n=4 per group). (R)-(S) Kidney acetyl- and long-chain acyl-CoA concentrations. (T) Plasma NEFA in FGF-21-infused mice, some treated with antagonists of Adrb1 or Adrb2 (in panels (T)-(V), n=6 vehicle- or Adrb2 antagonist-treated mice, or 5 Adrb1 antagonist-treated mice). (U)-(V) Kidney acetyl- and long-chain acyl-CoA concentrations. (W) Plasma NEFA in WT and whole-body Adrb2 KO mice (n=4 vehicle-treated or 5 FGF-21-treated mice per group). (X) Whole-body palmitate turnover in Atglf/f;Ksp-Cre mice infused with FGF-21 or vehicle, and their WT littermates (n=6 per group, with the exception of WT+FGF-21-treated mice, in which n=7 per group). Unless otherwise specified, groups were compared by the 2-tailed unpaired Student’s t-test. In all panels, *P<0.05, **P<0.01, ***P<0.001, ****P<0.0001.
Extended Data Figure 4.
Extended Data Figure 4.. FGF-21 is increased in renal cell carcinoma due to increased circulating VEGF.
(A) Photos of kidneys from the same mouse, injected with PBS (left) or with Renca cells (right), and a lung from a Renca tumor-bearing mouse, stained with India ink. Metastases appear white. (B) Tumor Vegfa and Fgf21 mRNA expression in human renal cell carcinoma (n=877 for both proteins). Data from the Human Protein Atlas. FKPM, fragments per kilobase of transcript per million mapped reads. (C) Tissue FGF-21 protein, measured by ELISA (n=6 liver, 6 kidney, and 5 tumor). (D) Plasma FGF-21 concentrations in mice injected with Renca cells into the renal cortex that did not ultimately grow out a palpable tumor (n=5 on day 0, and 6 on all subsequent days). (E) Survival of RCC patients whose tumors were in the upper and lower quartile (n=219 per quartile) for Vegfa expression. (F) Plasma VEGF concentrations in mice injected with Renca cells into the renal cortex that did not ultimately grow out a visualized tumor (n=6). (G) Plasma VEGF concentrations in mice with Renca RCC tumors (n=5 per timepoint until week 3, at which n=4). (H) Plasma NEFA concentrations in mice injected with recombinant VEGF (n=5 per group). In all panels, *P<0.05, **P<0.01, ***P<0.001, ****P<0.0001.
Extended Data Figure 5.
Extended Data Figure 5.. FGF-21 promotes renal glucose production in mice with renal cell carcinoma.
(A) Plasma FGF-21, (B) Plasma insulin, and (C) Plasma total bile acids in mice treated with an Fc-fused FGF-21 c-terminal peptide. (D) Plasma total bile acids in rats fasted for 8 or 48 hours, and 8 hr fasted rats infused with FGF-21. In all panels, n=5 per group. **P<0.01.
Extended Data Figure 6.
Extended Data Figure 6.. Renal gluconeogenesis is a targetable, pathogenic factor in murine models of RCC.
(A) Patients with low Slc2a1 and high cytosolic Pck1 expression (i.e. low glucose uptake through GLUT1 and high glucose production facilitated by PC expression at the transcriptional level) have poorer survival as compared to patients with high Slc2a1 and low Pck1 expression in tumor (n=67 low Slc2a1 and high Pck1, vs. 32 high Slc2a1 and low Pck1). Unfortunately, expression data from surrounding parenchyma are not available. In panels (A) and (B), “low” and “high” were defined as falling in both the upper and lower, or lower and upper quartile of expression of the genes of interest. (B) Patients with low Atgl (Pnpla2) and Adrb2 expression in RCC tumors (n=60) have worse survival than patients with high Atgl (Pnpla2) and Adrb2 expression in RCC tumors (n=82). (C) Survival of RCC patients whose tumors express low Adrb2, low Atgl, and low Pck 1 (n=27) vs. those whose tumors express high Adrb2, high Atgl, and high Pck 1 (n=13).
Extended Data Figure 7.
Extended Data Figure 7.. REGAL workflow and mechanistic summary.
(A) REGAL workflow. Figure created with BioRender.com and modified to add a GC/MS spectrum generated by the authors. (B) Mass Isotopomer Distribution Analysis strategy. (C) Proposed mechanism by which FGF-21 promotes renal glucose production and, in turn, renal cell carcinoma. Figure created with BioRender.com.
Figure 1.
Figure 1.. FGF-21 promotes renal gluconeogenesis under conditions of metabolic stress.
(A)-(B) Renal glucose production increases in fasting (n=5 per group) and diabetic ketoacidosis (n= 6 per group) in mice. (C) Renal gluconeogenic gene expression increases in humans with diabetic nephropathy (n=3 per group). (D) Renal glucose production increases in a mouse model of NASH. (E) Liver Fgf21 expression in humans with NAFLD (n=72, vs. n=6 healthy controls). (F)-(G) Recombinant FGF-21 infusion increases renal glucose production in rats (n=6 per group). (H)-(I) Hepatic and renal glucose production in 24 hour fasted liver-specific FGF-21 KO mice (n=3 per genotype). (J) Blood glucose concentrations (n=3 per genotype). In all panels, *P<0.05, **P<0.01, ***P<0.001, ****P<0.0001 by the 2-tailed unpaired Student’s t-test (panels A-B, D, H-J) or by ANOVA with Tukey’s multiple comparisons test (panels F-G). P-values for gene expression (panel E) were adjusted for multiple comparisons.
Figure 2.
Figure 2.. FGF-21 promotes renal gluconeogenesis via Adrb2-dependent neural hardwiring.
(A)-(B) Endogenous glucose production from liver and kidney, and the fractional contribution of the kidney to total glucose production in rats administered an ICV infusion of FGF-21 (n=4 vehicle and 5 FGF-21). (C)-(D) Endogenous glucose production, and the renal contribution to whole-body glucose production in Klbf/f;Camk2a-Cre mice (n=6 per genotype). (E)-(F) Endogenous glucose production, and the renal contribution to whole-body glucose production in 6 hr fasted mice infused with FGF-21 and pretreated with an Adrb1 or Adrb2 antagonist, or vehicle (n=6 vehicle, 5 Adrb1 antagonist, and 6 Adrb2 antagonist). (G)-(H) Endogenous glucose production, and the renal contribution to whole-body glucose production in Adrb2 knockout mice infused with FGF-21 (n=4 vehicle-treated in both genotypes, and 5 FGF-21-treated in both genotypes). In all panels, **P<0.01, ***P<0.001, ****P<0.0001 by the 2-tailed unpaired Student’s t-test.
Figure 3.
Figure 3.. FGF-21-induced increases in renal lipolysis promote increased renal gluconeogenesis in metabolic stress.
(A)-(B) Kidney long-chain acyl- and acetyl-CoA concentrations in mice infused with FGF-21±the nonspecific Adrb antagonist propranolol. In panels (A)-(C), groups were compared by ANOVA with Tukey’s multiple comparisons test, and n=5 per group. (C) Ex vivo pyruvate carboxylase (PC) activity. (D)-(E) Kidney long-chain acyl- and acetyl-CoA concentrations in whole-body Adrb2 knockout mice (n=4 vehicle-treated and 5 FGF-21-treated per genotype). In panels (D)-(L), groups were compared by the 2-tailed unpaired Student’s t-test. (F)-(G) Kidney long-chain acyl- and acetyl-CoA concentrations in kidney-specific ATGL knockout mice (Atglf/f;Ksp-Cre) (n=6 per group with the exception of WT+FGF-21-treated mice [n=7 per group]). (H) Kidney pyruvate carboxylase activity (in panels (H)-(L), n=6 per group with the exception of WT+FGF-21-treated mice [n=7 per group]). (I)-(J) Endogenous glucose production, and the renal contribution to whole-body glucose production. (K)-(L) Blood glucose and plasma insulin concentrations. In all panels, *P<0.05, **P<0.01, ***P<0.001, ****P<0.0001.
Figure 4.
Figure 4.. FGF-21 increases in a VEGF-dependent manner in murine models of kidney cancer.
(A) Plasma FGF-21 concentrations in a mouse model of renal adenoma (n=5 per group). (B)-(C) Plasma FGF-21 concentrations in mouse models of renal cell carcinoma (n=5 per group, with the exception of week 3 in kidney Renca tumor-bearing mice, in which n=4 due to the death of one of the mice). (D) FGF-21 concentrations in healthy mice treated acutely with recombinant VEGF (n=5). (E) Survival probability in RCC patients with low and high (lowest and highest 25th percentile) Slc2a1 (GLUT1) expression (n=219 per group). (F) Survival probability in RCC patients with low and high (lowest and highest 25th percentile) expression of both Vegfa (VEGF) and Slc2a1 (GLUT1) (n=224 per group). In all panels, *P<0.05, **P<0.01, ***P<0.001, ****P<0.0001.
Figure 5.
Figure 5.. FGF-21-dependent Adrb2 activity promotes renal glucose production in mice with RCC.
(A)-(C) Glucose production and blood glucose concentrations in Renca tumor-bearing mice treated with a Fc-fused FGF-21 c-terminal peptide (n=5 per group). (D) Glucose production in murine Renca and surrounding kidney samples (n=4 tumor and 4 surrounding kidney). (E) Glucose production in human RCC tumor and surrounding parenchyma (n=10). (F) Glucose production in human RCC parenchyma treated with clenbuterol or vehicle (n=5). In panels (E) and (F), the paired t-test was used because samples from the same patients were compared. In all panels, *P<0.05, **P<0.01, ***P<0.001, ****P<0.0001.
Figure 6.
Figure 6.. Increased renal glucose production promotes RCC tumor progression.
(A) Representative images of kidney stained with hematoxylin & eosin from Renca tumor-bearing mice treated with propranolol. (B) Treatment with the Adrb antagonist propranolol slows Renca tumor progression in mice (n=8 controls and 7 propranolol-treated mice). *P<0.05. (C) RCC patients who have ever been prescribed propranolol have improved survival as compared to RCC patients who have never taken propranolol. The 95% confidence interval is shown.

References

    1. Badman M. K. et al. Hepatic fibroblast growth factor 21 is regulated by PPARalpha and is a key mediator of hepatic lipid metabolism in ketotic states. Cell Metab 5, 426–437 (2007). - PubMed
    1. Inagaki T. et al. Endocrine regulation of the fasting response by PPARalpha-mediated induction of fibroblast growth factor 21. Cell Metab 5, 415–425 (2007). - PubMed
    1. Bergström A. et al. Obesity and renal cell cancer – a quantitative review. Br J Cancer 85, 984–990 (2001). - PMC - PubMed
    1. Renehan A. G., Tyson M., Egger M., Heller R. F. & Zwahlen M. Body-mass index and incidence of cancer: a systematic review and meta-analysis of prospective observational studies. Lancet 371, 569–578 (2008). - PubMed
    1. Courtney K. D. et al. Isotope Tracing of Human Clear Cell Renal Cell Carcinomas Demonstrates Suppressed Glucose Oxidation In Vivo. Cell Metab 28, 793–800.e2 (2018). - PMC - PubMed

Publication types