[Preprint]. 2023 Apr 13:rs.3.rs-2738048.
doi: 10.21203/rs.3.rs-2738048/v1.

Evolutionary and immune microenvironment dynamics during neoadjuvant treatment of oesophagael adenocarcinoma

Affiliations

Evolutionary and immune microenvironment dynamics during neoadjuvant treatment of oesophagael adenocarcinoma

Melissa Barroux et al. Res Sq. .

Update in

  • Evolutionary and immune microenvironment dynamics during neoadjuvant treatment of esophageal adenocarcinoma.
    Barroux M, Househam J, Lakatos E, Ronel T, Baker AM, Salié H, Mossner M, Smith K, Kimberley C, Nowinski S, Berner A, Gunasri V, Borgmann M, Liffers S, Jansen M, Caravagna G, Steiger K, Slotta-Huspenina J, Weichert W, Zapata L, Giota E, Lorenzen S, Alberstmeier M, Chain B, Friess H, Bengsch B, Schmid RM, Siveke JT, Quante M, Graham TA. Barroux M, et al. Nat Cancer. 2025 May;6(5):820-837. doi: 10.1038/s43018-025-00955-w. Epub 2025 May 14. Nat Cancer. 2025. PMID: 40369175 Free PMC article.

Abstract

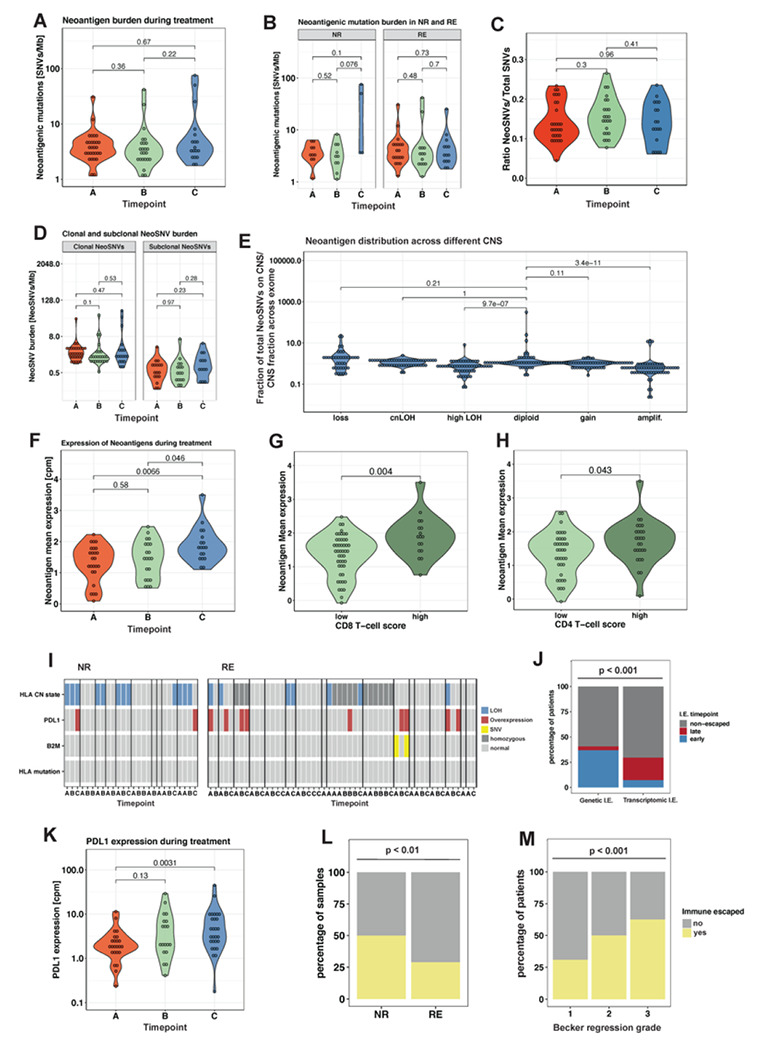
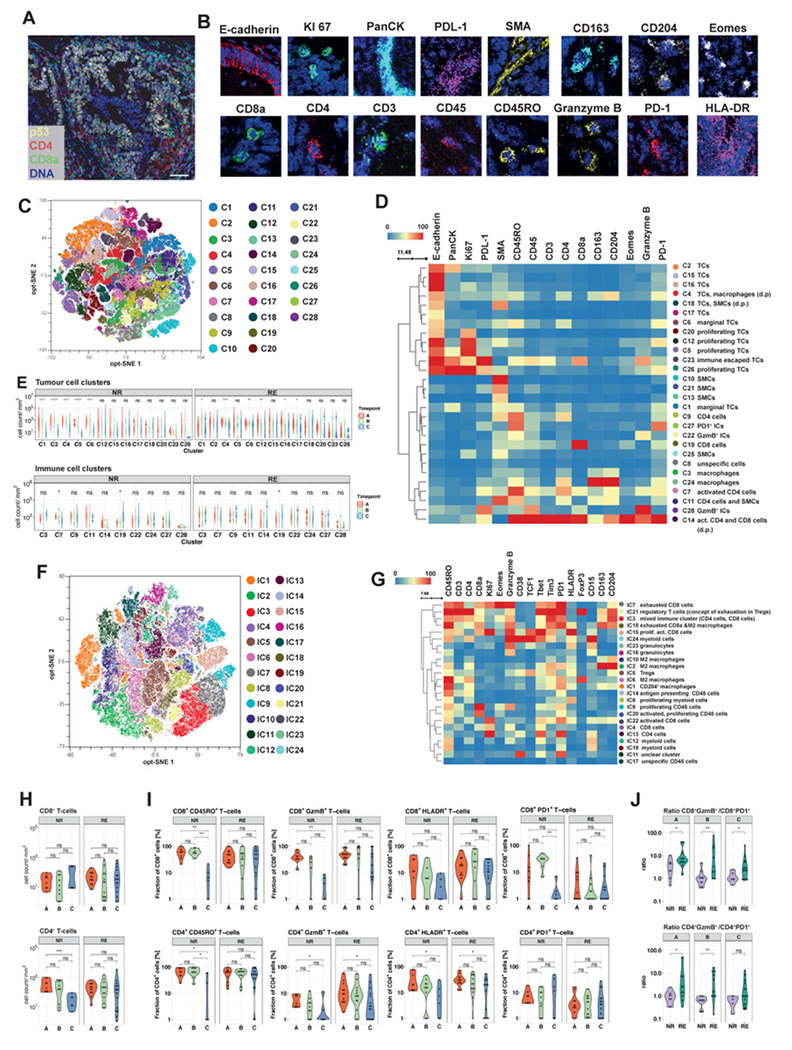
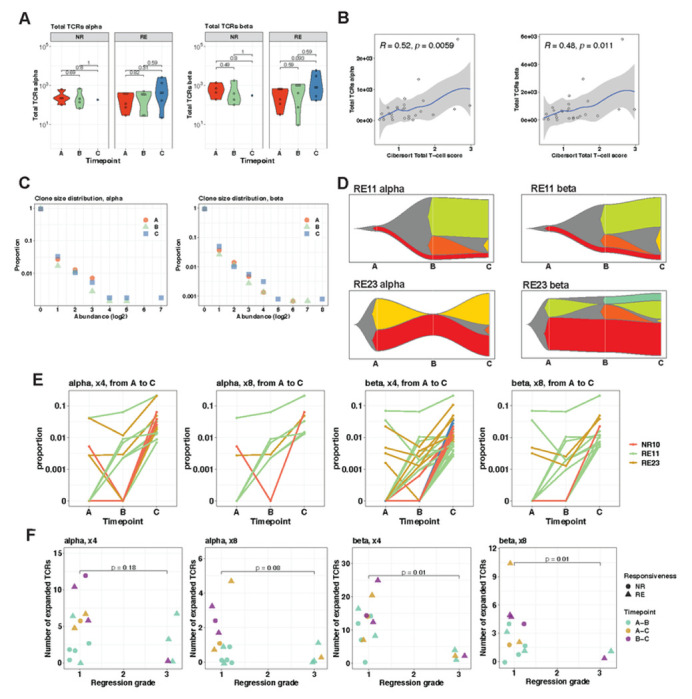
Locally advanced oesophageal adenocarcinoma (EAC) remains difficult to treat because of common resistance to neoadjuvant therapy and high recurrence rates. The ecological and evolutionary dynamics responsible for treatment failure are incompletely understood. Here, we performed a comprehensive multi-omic analysis of samples collected from EAC patients in the MEMORI clinical trial, revealing major changes in gene expression profiles and immune microenvironment composition that did not appear to be driven by changes in clonal composition. Multi-region multi-timepoint whole exome (300x depth) and paired transcriptome sequencing was performed on 27 patients pre-, during and after neoadjuvant treatment. EAC showed major transcriptomic changes during treatment with upregulation of immune and stromal pathways and oncogenic pathways such as KRAS, Hedgehog and WNT. However, genetic data revealed that clonal sweeps were rare, suggesting that gene expression changes were not clonally driven. Additional longitudinal image mass cytometry was performed in a subset of 15 patients and T-cell receptor sequencing in 10 patients, revealing remodelling of the T-cell compartment during treatment and other shifts in microenvironment composition. The presence of immune escape mechanisms and a lack of clonal T-cell expansions were linked to poor clinical treatment response. This study identifies profound transcriptional changes during treatment with limited evidence that clonal replacement is the cause, suggesting phenotypic plasticity and immune dynamics as mechanisms for therapy resistance with pharmacological relevance.


Figures

Figure 1
Figure 1. Experimental workflow and overview of the study cohort.
(A) Flowchart summarising patient treatment and study design, including respective neoadjuvant treatment, sample acquisition and analyses. FOLFOX: Oxaliplatin and 5-FU, EOX: epirubicin, oxaliplatin, capecitabine, RE: Responder, NR: Non-Responder, WES: whole exome sequencing, RNA-Seq: RNA-Sequencing, IMC: imaging mass cytometry, TCR-Seq: T-cell receptor sequencing. Overview of the study cohort of Non-Responders (B) and Responders (C) with indication of samples present for each type of data analysis. Samples from different timepoints are indicated with different shapes. RE: Responder; NR: Non-Responder; Gen: gender, Age: age at diagnosis; WES: whole-exome sequencing; RNA-Seq: RNA-Sequencing, IMC: imaging mass cytometry, TCR-Seq: T-cell receptor sequencing.
Figure 2
Figure 2. Evolutionary dynamics of mutations during neoadjuvant treatment in EAC.
(A-C) Violin plots showing the distribution of mutational burden during neoadjuvant treatmentfor all patients (A), stratified by treatment response (B) and stratified by clonality of mutation (C). Mutations of each sample were classified as clonal or subclonal based on the copy number and cellularity adjusted cancer cell fraction. P values in panels A-C are calculated by the Wilcoxon test. (D) Selected phylogenetic trees with clade length indicating the number of shared mutations between samples. Timepoint of samples are annotated at the tip of the clades with the letters A-C. Numbers at the nodes indicate bootstrap values. EAC drivers harbouring SNVs (without brackets) or indels (in squared brackets) and number of neoantigenic SNVs are annotated on the clades of the trees. RE: Responder, NR: Non-Responder, HI: homoplasy index, NeoSNVs: Neoantigenic single-nucleotide variant. (E) Proportion of SNV types in treatment-naive SNVs (left), SNVs occurring under chemotherapy (middle) and SNVs occurring under RCTx (right). SNV: single nucleotide variant, CTx: platin-based chemotherapy, RCTx: radiochemothearapy. A: adenine, T: thymine, C: cytosine, G: guanine. (F) Proportion of COSMIC Signatures in Non-Responders and Responders during treatment (COSMIC signature calling was limited to those with a weight > 5% in the respective groups). (G) Line graph showing changes in the proportion of COSMIC Signature 4 in Responders during treatment (H) Line graph showing changes in the proportion of COSMIC Signature 5 in Non-Responders during treatment. For multi-region samples means were plotted for each timepoint.
Figure 3
Figure 3. Dynamics in copy number alterations (CNAs) during neoadjuvant treatment.
(A) Plot showing genome-wide copy number state. Each row represents a sample, with samples from the same patient grouped together and patient ID is annotated on the left. Treatment response and timepoint of each sample are annotated on the right. Dashed vertical lines indicate the centromere of each chromosome and continuous vertical lines are separating different chromosomes. NR: Non-Responder, RE: Responder, CNS: copy number state, CNt: copy number (B)Percentage of altered exome in RE and NR during neoadjuvant treatment. (C) Fragment size of clonal, subclonal and private copy number alterations. In patients with only 2 samples available, no distinction between subclonal and private could be made and therefore CNAs were summarized in “subclonal/private” category. *** indicates p < 0.001 by the Wilcoxon test (D)Fraction of exome with changing copy number state between Timepoint A and B in NR and R. P values are calculated by the Wilcoxon-test. CNS: copy number state, TP: Timepoint, RE: Responder, NR: Non-Responder (E) Plot shows genetic alterations, including copy number alterations, SNVs and indels for putative cancer driver genes identified by IntOGen©. Each vertical column represents a sample. Samples of the same patients are grouped together and patient ID is annotated at the top. Information on timepoint, cancer cellularity and the patient’s pathological regression grade treatment are found in the top three rows. The following rows show information on genetic alterations in EAC driver genes. Cellularity was defined as low (15-30%), medium (31-60%), or high (61-100%). Regression grades were evaluated by a pathologist according to Becker regression classification. SNV: single nucleotide variant.
Figure 4
Figure 4. Neoadjuvant treatment leads to profound changes in gene and pathway expression in EAC.
(A) Principle component analysis of single sample gene set enrichment analysis of cancer hallmark gene sets PC: principal component. (B) Principal component feature loadings (magnitude and direction) from PCA in A. Vectors are colored according to their biological classification of cancer hallmark gene sets. (C) Hierarchical clustering with heatmap showing the significantly differentially expressed pathways between the two clusters (left cluster is predominantly samples from timepoint A/B and right cluster is predominantly timepoint C). (D) Enrichment in KEGG pathways in Non-Responders between Timepoint A and C (upper left), and between Timepoint B and C (upper right), and in Responders between Timepoint A and C (lower left), and between Timepoint B and C (lower right). Dotted line indicates significance level of padj < 0.05. (E) Plot shows immune cell composition based on CIBERSORT analysis in Responders and Non-Responders during neoadjuvant treatment.
Figure 5
Figure 5. Increasing immune escape during neoadjuvant treatment correlates with poor treatment response.
(A-D) Violins showing the neoantigenic mutational burden during neoadjuvant treatment in all samples (A), stratified by treatment response (B), expressed as a proportion of total SNVs (C), and stratified by clonality (D). (Clonal and subclonal neoantigenic mutational burden during neoadjuvant treatment. Mutations of each sample were classified as clonal or subclonal based on the copy number and cellularity adjusted CCF. CNS: copy number state (E) Distribution of neoantigenic SNVs based on their copy number-states. The copy-number normalised proportion of neoantigenic SNVs in each CN segment was calculated. (F)Expression of neoantigens during treatment. (G-H) Neoantigen expression in EAC according to immune infiltration score for (G) CD8 T-cells and (H) CD4 T-cells. (I) Presence of HLA LOH, PD-L1 overexpression and B2M mutations in individual samples from Non-Responders (left) and Responders (right). Samples from individual patients are separated by vertical black lines. PD-L1 overexpression was defined as PD-L1 expression >2 standard deviations from the mean of all treatment naive samples. (J) Proportion of immune escaped patients. Genetic immune escape refers to mutations or LOH in HLA or B2M mutations, whereas PD-L1 overexpression represents transcriptomic immune escape. P value calculated by the chi-square test. (K) PD-L1 expression during neoadjuvant treatment. (L-M) Proportion of immune escaped patients stratified by treatment response (L) and pathological regression grades (M). P value calculated by the chi-square test. P values in all panels are calculated by the Wilcoxon test, unless stated otherwise.
Figure 6
Figure 6. Highly multiplexed imaging mass cytometry analysis reveals different T cell phenotype dynamics in Non-Responders and Responders during treatment.
(A) Representative image IMC staining of EAC tissue. Scale bar: 100μm. p53 (yellow), CD4 (red), CD8a (green) and DNA (blue) from IMC data channels are displayed. (B) Representative IMC images of each marker together with DNA (blue). (C) t-SNE visualization of the EAC tumour, stromal and immune map based on 28 identified cell clusters. (D) Heatmap visualization of marker expression in the 28 cell clusters. Normalized median marker expression is shown. TCs: tumour cells, SMCs: smooth muscle cells, ICs: immune cells, act: activated, d.p.: in direct proximity to each other, GzmB: Granzyme B (E) Cell cluster dynamics during treatment are shown for Responders and Non-Responders (F) t-SNE visualization of CD45+ cell map based on 24 identified cell clusters (G) Heatmap visualization of marker expression in the 24 CD45+ cell clusters. Normalized median marker expression is shown. d.p.: in direct proximity to each other (H) Absolute CD4 and CD8 cell counts per mm2 during treatment. (I) T cell phenotypes in EAC patients during treatment were analysed for markers of T cell activation and exhaustion. Fractions of CD4 cells (top row) and CD8 cells (bottom row) were compared among patient groups and visualized by violin plots. (J) Ratio of activated and exhausted CD4 cells (top row) and CD8 cells (bottom row) is shown during treatment for REs and NRs. P values in all panels are calculated by the Wilcoxon test, unless stated otherwise.
Figure 7
Figure 7. T-cells show clonal expansion in patients with neoadjuvant treatment response.
(A) Numbers of total TCRs α-chain (left) and β-chain (right) in Responders and Non-Responders during treatment. P values are calculated by the Wilcoxon test. (B) Correlation between TCR countsα-chain (left) and β-chain (right) and quantitative deconvolution of T-cells from RNA-Seq data via CIBERSORT. Pearson’s correlation coefficients are reported in the plots (C) Abundance distribution profile of TCRs at timepoints A-C. The y-axis shows the proportion of the TCRs which are found at the abundance indicated by the x-axis. (D) Fishplots show the occurrence of expanded TCRs at each timepoint for RE11 (top) and RE23 (bottom). (E) The proportions of T cell clones that are expanded 4-fold and ≥8-fold between timepoint A and C. (F) Numbers of TCRs expanded ≥4-fold and ≥8-fold during treatment periods (A-B, A-C, B-C), stratified by pathological regression grades. P values are calculated by the Mann-Whitney U test.

References

    1. Sung H. et al. Global cancer statistics 2020: GLOBOCAN estimates of incidence and mortality worldwide for 36 cancers in 185 countries. CA Cancer J Clin, doi:10.3322/caac.21660 (2021). - DOI - PubMed
    1. Morgan E. et al. International trends in oesophageal cancer survival by histological subtype between 1995 and 2014. Gut 70, 234–242, doi:10.1136/gutjnl-2020-321089 (2021). - DOI - PubMed
    1. Davies A. R. et al. Tumor stage after neoadjuvant chemotherapy determines survival after surgery for adenocarcinoma of the esophagus and esophagogastric junction. J. Clin. Oncol. 32, 2983–2990, doi:10.1200/JCO.2014.55.9070 (2014). - DOI - PubMed
    1. Findlay J. M. et al. Differential clonal evolution in oesophageal cancers in response to neo-adjuvant chemotherapy. Nat Commun 7, 11111, doi:10.1038/ncomms11111 (2016). - DOI - PMC - PubMed
    1. Murugaesu N. et al. Tracking the genomic evolution of esophageal adenocarcinoma through neoadjuvant chemotherapy. Cancer Discov 5, 821–831, doi:10.1158/2159-8290.CD-15-0412 (2015). - DOI - PMC - PubMed

Publication types

LinkOut - more resources