[Preprint]. 2024 Aug 17:2023.04.12.536536.
doi: 10.1101/2023.04.12.536536.

RAD52 prevents accumulation of Polα -dependent replication gaps at perturbed replication forks in human cells

Affiliations

RAD52 prevents accumulation of Polα -dependent replication gaps at perturbed replication forks in human cells

Ludovica Di Biagi et al. bioRxiv. .

Abstract

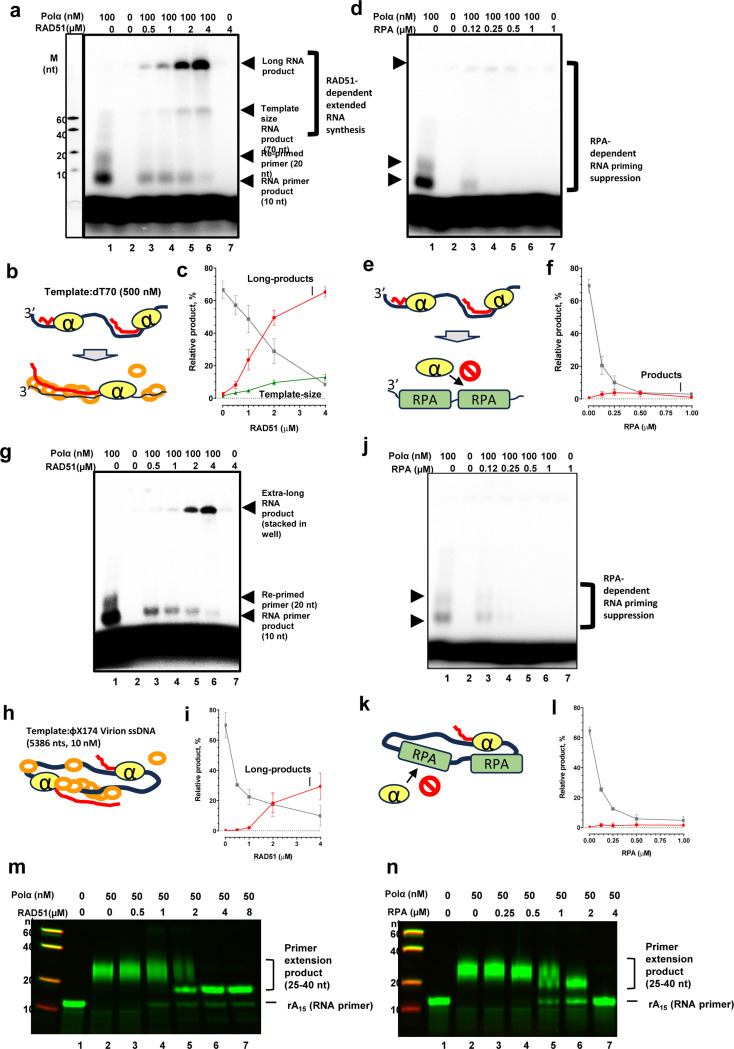
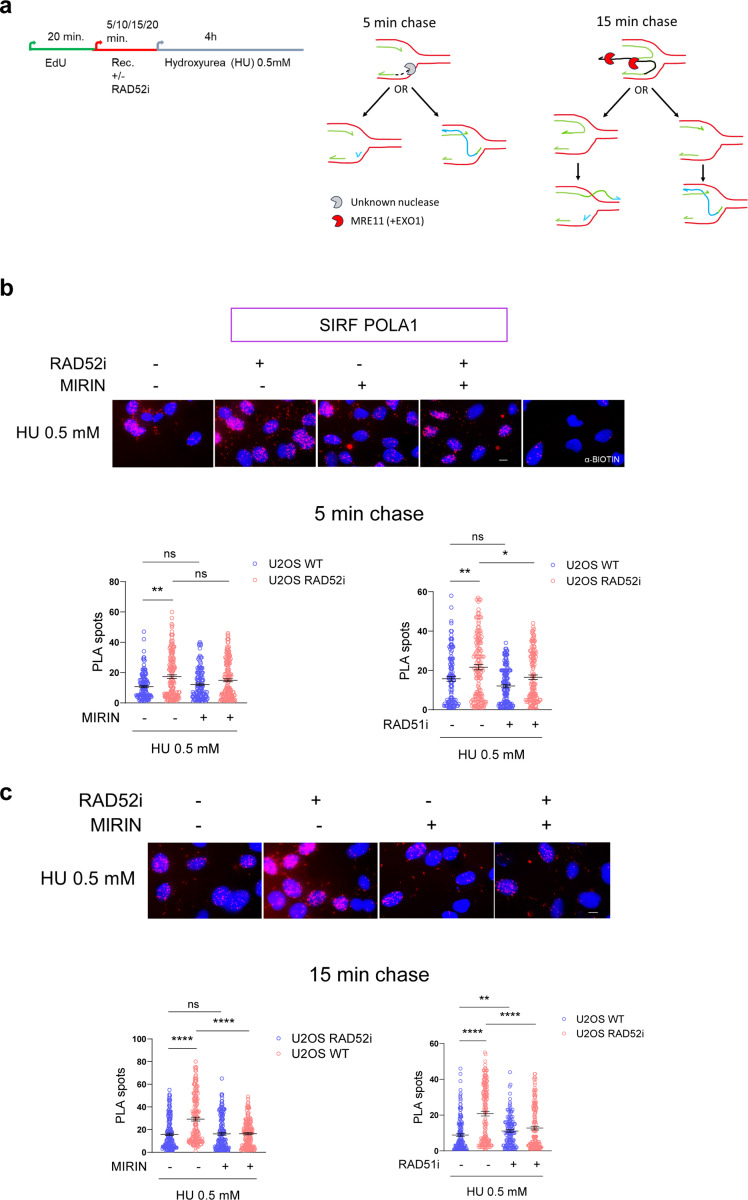
Replication gaps can arise as a consequence of perturbed DNA replication and their accumulation might undermine the stability of the genome. Loss of RAD52, a protein involved in the regulation of fork reversal, promotes accumulation of parental ssDNA gaps during replication perturbation. Here, we demonstrate that this is due to the engagement of Polα downstream of the extensive degradation of perturbed replication forks after their reversal, and is not dependent on PrimPol. Polα is hyper-recruited at parental ssDNA in the absence of RAD52, and this recruitment is dependent on fork reversal enzymes and RAD51. Of note, we report that the interaction between Polα and RAD51 is stimulated by RAD52 inhibition, and Polα -dependent gap accumulation requires nucleation of RAD51 suggesting that it occurs downstream strand invasion. Altogether, our data indicate that RAD51- Polα -dependent repriming is essential to promote fork restart and limit DNA damage accumulation when RAD52 function is disabled.


Conflict of interest statement

CONFLICT OF INTEREST The authors declare to do not have any conflict of interest

Figures

Fig. 1 -
Fig. 1 -. RAD52 deficiency stimulates repriming.
a. Analysis of parental ssDNA exposure by immunofluorescence. MRC5 WT were treated as indicated on the experimental scheme above. For untreated cells, Epigallocatechin (RAD52i, 50 μM) was kept for 4 hours. After the exposure to 2 mM hydroxyurea (HU), replication recovery was given by adding fresh medium. The ssDNA was detected by IdU immunofluorescence. Graph shows the intensity of ssDNA staining (AU) per cell from three replicates. Representative images are shown. Scale bar represents 10 μm. b and c. Effect of Mirin on parental ssDNA exposure. U2OS WT were treated with 4h HU as indicated in A (B) or with 0.5 mM HU (C). Graph shows the intensity of ssDNA staining (AU). Representative images are shown. Scale bar represents 10 μm. c. Detection of ssDNA gaps in U2OS through S1 fibers assay. On top: schemes describing the experiment. Cells were treated with or without the S1 nuclease before spreading of DNA fibers. The graph reports the IdU/CldU ratio for each DNA fiber. Representative images of single DNA fibers are shown. Scale bar represents 5 μm. All the values above are presented as means ± SE (ns = not significant; *P < 0.1; **P<0.1; ***P < 0.001; ****P < 0.0001; Kruskal-Wallis test).
Fig. 2 -
Fig. 2 -. Parental DNA gaps are Polα-, but not PrimPol-, dependent in the absence of RAD52.
a. Analysis of ssDNA gaps through S1 fiber assay. Wild-type MRC5 or KO PrimPol were treated with 0.5 μM HU for 4 hours. RAD52i was given 30 min before replicative stress induction. The graph reports the mean IdU/CldU ratio. b. Analysis of PrimPol-ssDNA interaction using Proximity Ligation Assay (PLA). MRC5 −/− PrimPol were transfected with peGFP-PrimPol WT. 24 hours after transfection, cells were treated with 100 μM IdU for 20 hours, released for 2 hours in fresh medium and subjected to RAD52i and HU (0.5 mM). To assess PrimPol-ssDNA association, the PLA reaction was carried out using antibodies against GFP and IdU. Controls were subjected to PLA with anti-IdU or anti-GFP only. The graph reports the number of PLA spot per nucleus. Representative images are shown. c. Analysis of PrimPol recruitment on DNA by chromatin fractionation. MRC5 KO PrimPol were transfected with peGFP-PrimPol WT. After 48 hours from transfection, cells were treated with RAD52i and HU (0.5 mM) for 2 and 4 hours. Cell pellets were subjected to chromatin fractionation and the protein extracts were quantified by Western Blotting. PrimPol was identified by using an antibody directed against GFP. The whole cell extracts was used as control (INPUT). d. Analysis of Polα-parental ssDNA interaction by PLA. U2OS WT were treated with 100 μM IdU for 20 hours, released for 2 hours in fresh medium and subjected to RAD52i and HU (0.5 mM). The PLA reaction was carried out using antibodies against the POLA1 Polα subunit and IdU. The graph reports the number of PLA spot per nucleus. The control was subjected to PLA with the anti-Polα alone. Representative images are shown. e. Analysis of parental ssDNA exposure in Polα-inhibited cells. U2OS WT were treated as indicated on the experimental scheme. ST1926 (Polαi) was given at 0.3 μM. Graph represents the IdU intensity (AU) per cell. Representative images are reported. f. Analysis of ssDNA gaps through S1 fiber assay. Wild-type MRC5 or MRC5 KO PrimPol were treated with Polαi (0.3 μM) and RAD52i 30 min before HU (0.5 mM; 4h). The graph shows the mean IdU/CldU ratio. (ns = not significant; *P < 0.1; **P<0.1; ***P < 0.001; ****P < 0.0001; Mann–Whitney test;). Scale bars represent 10 μm.
Fig. 3 -
Fig. 3 -. Polα recruitment under RAD52 deficiency depends on replication fork remodelling.
a. Analysis of Polα - parental ssDNA interaction by PLA in U2OS shSMARCAL1. SMARCAL1 silencing was induced by giving Doxycycline (Dox) 24 hours before treatment with IdU for 20 hours. The cells were then released for 2 hours in fresh medium and treated with or without RAD52i 30 min before giving HU (2 mM). PLA reaction was carried out using antibodies against POLA1 and IdU. Graph shows the number of PLA spot per nucleus. Representative images are shown. b. Analysis of Polα recruitment at DNA through chromatin fractionation. U2OS shSMARCAL1 were treated as described above. Polα was identified by using an antibody directed against the Polα subunit POLA1, and LAMIN B1 used as loading control. A graph of POLA1/LAMIN B1 quantification from 3 replicates is reported below c. Analysis of Polα-parental ssDNA in U2OS WT. Cells were treated with IdU for 20 hours, released 2 hours in fresh medium, and subjected to RAD52i and MIRIN before giving HU (2 mM). PLA reaction was carried out using antibodies against POLA1 and IdU. The graph reports the number of PLA spot per nucleus. Representative images are shown. (ns = not significant; *P < 0.1; **P<0.1; ***P < 0.001; ****P < 0.0001; Kruskal-Wallis test;). Scale bars represent 10 μm. d. Analysis of Polα-parental ssDNA interaction in U2OS WT or transfected with BRCA2 siRNA. Western blot showsBRCA2 expression level after silencing with the siRNA. After IdU labelling, cells were treated with MIRIN and HU (2 mM). PLA reaction was carried out using antibodies against POLA1 and IdU. Graph shows the number of PLA spots per nucleus. Representative images are shown. e. Western blot showing BRCA2 and GFP expression level. LAMIN B1 was used as loading control. f. Analysis of PrimPol-parental ssDNA association by PLA. MRC5 KO PrimPol were transfected with peGFP-PrimPol WT. On the same day, cells were transfected with the BRCA2 siRNA. 24 hours after transfections, cells were treated with IdU for 20 hours, released for 2 hours in fresh medium and subjected to RAD52i or MIRIN and HU (0.5 mM). Graph shows the number of PLA spots per nucleus. g. Analysis of Polα-parental ssDNA interaction in MRC5 shBRCA2 and MUS81 KO. BRCA2 silencing was obtained by treating the cells with Dox (1μg/ml) 48 hours before HU (2 mM) exposure. BRCA2 silencing was confirmed by qRT–PCR analysis (See Fig. S11). PLA reaction was carried out using antibodies against POLA1 and IdU. Graph shows the number of PLA spots per nucleus. (ns = not significant; *P < 0.1; **P<0.1; ***P < 0.001; ****P < 0.0001; Kruskal-Wallis test;). Scale bars represent 10 μm.
Fig. 4 –
Fig. 4 –. RAD52 inhibition increases Polα-RAD51 association.
a. Analysis of Polα-RAD51 association by PLA in U2OS WT. Cells were subjected to RAD52i 30 min before HU (2 mM) treatment. PLA reaction was carried out using antibodies against POLA1 and RAD51. The graph shows the number of PLA spot per nucleus. The control was subjected to PLA with only one primary antibody. Representative images are shown. Scale bar represents 10 μm b. Analysis of Polα-RAD51 association by PLA in U2OS WT. Cells were exposed to RAD52i 20 min before HU (0.5 mM) treatment of 2 and 4 hours. PLA reaction was carried out using antibodies against POLA1 and RAD51. The graph shows the number of PLA spot per nucleus. c. Experimental scheme of super-resolution (SR) microscopy assay. d. Quantification of EdU-RAD51-Polα interaction by SR microscopy (dSTORM). U2OS WT were treated as indicated on the panel C. The graph represents the percentage of variation in co-localization events of EdU-RAD51, EdU- Polα and EdU-RAD51-Polα. e. Representative dSTORM images of two nuclei immunolabeled for nascent DNA (cyan), Polα (magenta) and RAD51 (yellow). Scale bars = 20μm, 1μm and 100nm. A representative sketch of a common topology of the 3 signal is also shown. All the values above are presented as means ± SE (ns = not significant; *P < 0.1; **P<0.1; ***P < 0.001; ****P < 0.0001; Kruskal-Wallis test;).
Fig. 5 -
Fig. 5 -. Polα engagement is mediated by RAD51.
a. Analysis of Polα-parental ssDNA association by PLA. U2OS WT were treated with IdU for 20 hours, released for 2 hours in fresh DMEM and successively treated with or without RAD52i and RAD51i 30 min before HU (2 mM). The graph shows the number of PLA spot per nucleus. Representative images are shown. b. Analysis of Polα recruitment at the DNA by chromatin fractionation. MRC5 WT were treated with RAD52i and RAD51i 30 min before HU (2mM). Polα was identified by using an antibody directed against the Polα subunit POLA1. The whole cell extracts was used as control (INPUT). A graph of POLA1/LAMIN B1 quantification from 3 replicates is reported below. c. Western blot and quantification graph showing the level of RAD51 expression in RAD51 siRNA J11-transfected cells (2 pmol and 20 pmol). d. Analysis of Polα-parental ssDNA association by PLA in U2OS WT. Cells were transfected with the RAD51 siRNA (J11) at 2 pmol and 20 pmol 24 hours before 20 hours of IdU labelling. After 2 hours of release in fresh medium, cells were treated with RAD52i 30 min before giving HU (2 mM). PLA reaction was carried out using antibodies against POLA1 and IdU. The graph reports the number of PLA spot per nucleus. Representative images are shown. e. Analysis of Polα-parental ssDNA association by PLA. U2OS WT were treated as indicated by the experimental scheme above. The graph shows the number of PLA spot per nucleus. Representative images are reported. All the values above are presented as means ± SE (ns = not significant; *P < 0.1; **P<0.1; ***P < 0.001; ****P < 0.0001; Kruskal–Wallis test;). Scale bars represent 10 μm.
Fig. 6 -
Fig. 6 -. RPA and RAD51 differentially regulate Polα/Primase activities.
a, RAD51 titration on Polα/Primase de novo RNA synthesis on dT70 mer templates, with products labelled with [α32P]ATP. Size markers are synthesized Cy3-labelled poly(dT) ssDNA with a length of 10, 20, 40 and 60. b, Model depicting the observed elongated RNA products in the presence of RAD51 (orange circle). Polα–primase (yellow circle labeled as α) binds the template poly(dT)70 and synthesize RNA primer (red) that length could be modulated by RAD51. c, Quantification of RNA products in the experiment directly above. 10 and 20 nt RNA priming product (grey), template size RNA product (green) and long RNA product that is stacked in the well (red). d, RPA titration on Polα/Primase de novo RNA synthesis on dT70 mer templates, with products labelled with [α32P]ATP. e, Model depicting the observed elongated RNA products in the presence of RPA (green square). Polα–primase (yellow circle labeled as α) binds the template poly(dT)70 and synthesize RNA primer (red) while its activity are attenuated in the presence of RPA. f, Quantification of RNA products in the experiment directly above. 10 and 20 nt RNA priming product (grey) and long RNA product (red). g-l, Same as a-f except using long circular ssDNA (φX174 Virion DNA) as a template instead of poly(dT)70. Polα/Primase no longer generate 70 nt RNA product in the presence of RAD51. m and n, The 5’-Cy3-labeled poly-rA15 primer was extended by DNA synthesis activity of Polα/Primase in the presence of dATP and on RAD51 (m) and RPA (n) titration. Size markers are synthesized Cy3-labelled poly(dT) ssDNA.
Fig. 7 -
Fig. 7 -. Polα recruitment occurs downstream extensive replication fork degradation.
a. Experimental scheme of single-cell assay for in situ Protein Interaction (SIRF). b. Analysis of Polα-nascent ssDNA interaction by SIRF. U2OS WT were treated as indicated above. The model on the left represents the expected background. SIRF reaction was carried out after the Click-iT reaction by using antibodies against POLA1 and biotin. The graph shows the mean number of SIRF spots per nucleus only of cells subjected to 5 minutes of recovery from EdU labelling. Where present, the representative images are shown above the graph. Controls were subjected to SIRF with anti-biotin only. c. Analysis of Polα-nascent ssDNA interaction by SIRF. U2OS WT were treated as indicated above. SIRF reaction was carried out after the Click-iT reaction by using antibodies against POLA1 and biotin. The graph shows the number of SIRF spots per nucleus only of cells subjected to 15 minutes of recovery from EdU labelling. Where present, the representative images are shown above the graph. d. Analysis of RAD51-nascent DNA interaction by SIRF in U2OS shBRCA2. Cells were exposed to EdU labelling during all the HU treatment. SIRF reaction was carried out using antibodies against RAD51 and biotin. The graph shows the mean number of SIRF spots per cell. BRCA2 silencing was induced by giving Dox (1μg/ml) 48 hours before the experiment. BRCA2 silencing was confirmed by qRT–PCR analysis of BRCA2 mRNA level 48 hours after doxycycline induction (See suppl. Fig 11). e. Analysis of RAD52-parental ssDNA interaction by PLA. U2OS WT were treated with IdU for 20 hours. After a release of 2 hours in fresh medium, cells were subjected to Polαi (ST1926, 1 μM) alone or combined with HU (0.5 or 2 mM; 2h). PLA reaction was carried out using antibodies against RAD52 and IdU. Graph shows the number of PLA spots per nucleus. Controls were subjected to PLA with anti-RAD52 only. Representative images are shown. Means ± SE are reported in scatter plots (ns = not significant; *P < 0.1; **P<0.1; ***P < 0.001; ****P < 0.0001; Kruskal–Wallis test;). Scale bars represent 10 μm.
Fig. 8 -
Fig. 8 -. Polα-repriming prevents DSBs formation and chromosomal aberrations in RAD52 deficient cells.
a. DSBs detection by immunofluorescence. U2OS WT were treated for 4h with HU and inhibitors, and recovered for 18h in drug-free medium before analysis. Immunofluorescence was carried out by using an antibody against γH2AX. The graph shows the percentage of γH2AX positive cells. Representative images are shown. b. Analysis of chromosomal aberrations in MRC5SV40 cells treated as in the experimental scheme above. The graphs show the mean of total chromosomal aberrations per cell and the mean of chromosomal breaks (c) and complex chromosomal aberrations per cell (d). Representative images of Giemsa-stained metaphases are given. Red arrows indicate chromosomal breaks; Framed in blue are shown other chromosomal aberrations and chromosomal exchanges. Insets show a magnification of the marked chromosome. e. 53BP1 NBs detection. Cells were treated as indicated in the experimental scheme above. Immunofluorescence was carried out by using an antibody against 53BP1. The graph shows the number of cells presenting 53BP1 NBs (0, 0–10 or >10). All the values above are presented as means ± SE (ns = not significant; *P < 0.1; **P<0.1; ***P < 0.001; ****P < 0.0001; ANOVA test;). Scale bars represent 10 μm. f. Model describing the RAD51-dependent Polα recruitment and gap formation downstream extensive degradation triggered by RAD52 deficiency.

Similar articles

Cited by

References

    1. Flynn R. L. & Zou L. ATR: A master conductor of cellular responses to DNA replication stress. Trends Biochem. Sci. 36, 133–140 (2011). - PMC - PubMed
    1. Zeman M. K. & Cimprich K. A. Causes and consequences of replication stress. Nat. Cell Biol. 16, 2–9 (2014). - PMC - PubMed
    1. Thakar T. & Moldovan G. The emerging determinants of replication fork stability. Nucleic Acids Res. 49, 7224–7238 (2021). - PMC - PubMed
    1. Franchitto A. & Pichierri P. Replication fork recovery and regulation of common fragile sites stability. Cell. Mol. Life Sci. 71, 4507–4517 (2014). - PMC - PubMed
    1. Pasero P. & Vindigni A. Nucleases Acting at Stalled Forks: How to Reboot the Replication Program with a Few Shortcuts. Annu. Rev. Genet. 51, 477–499 (2017). - PubMed

Publication types