. 2023 Mar;8(2):e1066.
doi: 10.1097/PR9.0000000000001066.

Epidemiology of neuropathic pain: an analysis of prevalence and associated factors in UK Biobank

Affiliations

Epidemiology of neuropathic pain: an analysis of prevalence and associated factors in UK Biobank

Georgios Baskozos et al. Pain Rep. 2023 Mar.

Abstract

Introduction:: Previous epidemiological studies of neuropathic pain have reported a range of prevalences and factors associated with the disorder.

Objectives:: This study aimed to verify these characteristics in a large UK cohort.

Methods:: A cross-sectional analysis was conducted of 148,828 UK Biobank participants who completed a detailed questionnaire on chronic pain. The Douleur Neuropathique en Quatre Questions (DN4) was used to distinguish between neuropathic pain (NeuP) and non-neuropathic pain (non-NeuP) in participants with pain of at least 3 months' duration. Participants were also identified with less than 3 months' pain or without pain (NoCP). Multivariable regression was used to identify factors associated with NeuP compared with non-NeuP and NoCP, respectively.

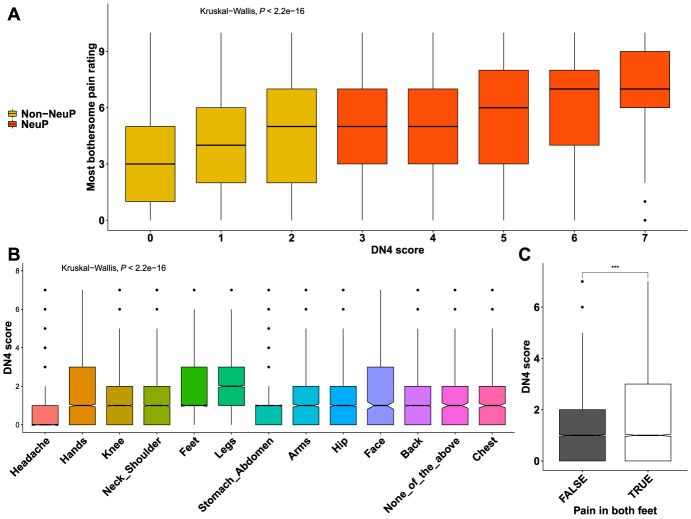
Results:: Chronic pain was present in 76,095 participants (51.1%). The overall prevalence of NeuP was 9.2%. Neuropathic pain was significantly associated with worse health-related quality of life, having a manual or personal service type occupation, and younger age compared with NoCP. As expected, NeuP was associated with diabetes and neuropathy, but also other pains (pelvic, postsurgical, and migraine) and musculoskeletal disorders (rheumatoid arthritis, osteoarthritis, and fibromyalgia). In addition, NeuP was associated with pain in the limbs and greater pain intensity and higher body mass index compared with non-NeuP. Female sex was associated with NeuP when compared with NoCP, whereas male sex was associated with NeuP when compared with non-NeuP.

Conclusion:: This is the largest epidemiological study of neuropathic pain to date. The results confirm that the disorder is common in a population of middle- to older-aged people with mixed aetiologies and is associated with a higher health impact than non-neuropathic pain.


Conflict of interest statement

Conflicts of interest There are no conflicts of interest.

Figures

Figure 1.
Figure 1.
Demographics of participants with chronic NeuP, non-NeuP, and NoCP. (A) Boxplots show the age of participants when questionnaires were completed for each group. Notched line represents the median. (B) Stacked bar plots show the sex distribution across the 3 groups. (C) Stacked bar plots show the ethnic background distribution across the 3 groups. (D) Boxplots show the BMI of participants across the 3 groups. Omnibus ANOVAs are labelled in the plot and are followed up by t tests between groups. P value <0.001 is coded as ***, P value <0.01 is coded as **. Post hoc tests are shown in supplementary Figure 2, available at http://links.lww.com/PR9/A186. ANOVA, analysis of variance; BAME, Black, Asian, and Minority ethnicities; BMI, body mass index; CP, chronic pain; NeuP, neuropathic pain; NoCP, no chronic pain.
Figure 2.
Figure 2.
Socioeconomic status of participants with chronic NeuP, non-NeuP, and NoCP. (A) Dotplot shows the employment status of participants for each group. The group is colour coded, and the respective percentage is coded in the size of the dot. (B) Dotplot shows the occupation of participants for each group. (C) Boxplots show the Index of Multiple Deprivations across the three groups. Omnibus ANOVAs are labelled in the plot and are followed up by t tests between groups. P value <0.001 is coded as. Post hoc tests are shown in supplementary Figure 3, available at http://links.lww.com/PR9/A186. ANOVA, analysis of variance; CP, chronic pain; NeuP, neuropathic pain; NoCP, no chronic pain.
Figure 3.
Figure 3.
Pain rating and location of the most bothersome pain. (A) Boxplots show the pain rating for the self-reported location of the most bothersome pain for both painful groups, NeuP vs non-NeuP. (B) Dotplot shows the frequencies for the self-reported location of the most bothersome pain for the 2 painful groups. Rates are coded in the size of the dot. P value <0.001 is coded as ***. NeuP, neuropathic pain.
Figure 4.
Figure 4.
The impact of pain in quality of life. (A) Boxplots show the EQ5D index across the 3 groups. (B) Boxplots show the EQ-5D index for both painful groups across all locations reported as the ones having the most bothersome pain. Omnibus ANOVAs are labelled in the plot and are followed up by t tests between groups. P value <0.001 is coded as ***, P value <0.01 is coded as **. Post hoc tests are shown in supplementary Figure 4, available at http://links.lww.com/PR9/A186. ANOVA, analysis of variance; CP, chronic pain; NeuP, neuropathic pain.
Figure 5.
Figure 5.
(A) Frequencies of diseases across the 3 groups. The rates are coded in the size of the dot. Group allocation is colour coded. Post hoc tests are shown in supplementary Figure 5, available at http://links.lww.com/PR9/A186. (B) MNSI scores across the 3 groups in participants with diabetes, rheumatoid arthritis, and other neuropathy. P value < 0.001 is coded as ***.ANOVA, analysis of variance; CP, chronic pain; MNSI, Michigan Neuropathy Screening Instrument; NeuP, neuropathic pain.
Figure 6.
Figure 6.
Pain rating and DN4 scores. (A) Boxplots show the distribution of pain ratings for the most bothersome locations across DN4 scores for both painful groups. Group is colour coded. (B) Boxplots show the DN4 score for all different locations of self-reported most bothersome pain. (C) DN4 scores for people with and without pain in both feet, Omnibus Kruskall–Wallis tests are labelled in the plot. P value <0.001 is coded as ***. DN4, Douleur Neuropathique en Quatre Questions; NeuP, neuropathic pain.
Figure 7.
Figure 7.
Intensity of pain vs participant characteristics. (A) Boxplots show the distribution BMI for different self-reported pain intensities for the most bothersome location. (B) Boxplots show the EQ5D index across self-reported pain intensities for the most bothersome locations. (C) Frequencies of employment status across self-reported pain intensities for the most bothersome locations. (D) Index of Multiple Deprivations or different self-reported pain intensities for the most bothersome location. Notched lines represent the median. BMI, body mass index.
Figure 8.
Figure 8.
Coefficient estimates of the multinomial logit model. Dots represent the exponentiated coefficient estimates, ie, odds ratios, and lines show the 95% confidence interval for all terms with an 1-way ANOVA P value <0.05. Odds ratios are calculated for NeuP and non-NeuP against the reference level NoCP. ANOVA, analysis of variance; NeuP, neuropathic pain; NoCP, no chronic pain.
Figure 9.
Figure 9.
Coefficient estimates of the binomial logit model for the 2 painful groups. Dots represent the exponentiated coefficient estimates, ie, odds ratios, and lines show the 95% confidence interval for all terms with an 1-way ANOVA P value <0.05. Odds ratios are calculated for NeuP against the reference level non-NeuP. The P value is colour coded. ANOVA, analysis of variance; BMI, body mass index; BPI, Brief Pain Inventory; NeuP, neuropathic pain.

References

    1. Abbott CA, Malik RA, Van Ross ERE, Kulkarni J, Boulton AJM. Prevalence and characteristics of painful diabetic neuropathy in a large community-based diabetic population in the U.K. Diabetes Care 2011;34:2220–4. - PMC - PubMed
    1. Aslam A, Singh J, Rajbhandari S. Prevalence of painful diabetic neuropathy using the self-completed Leeds assessment of neuropathic symptoms and signs questionnaire in a population with diabetes. Can J Diabetes 2015;39:285–95. - PubMed
    1. Attal N, Lanteri-Minet M, Laurent B, Fermanian J, Bouhassira D. The specific disease burden of neuropathic pain: results of a French nationwide survey. PAIN 2011;152:2836–43. - PubMed
    1. Bae S-C, Lee YH, Lee H, Lee YH. Causal association between body mass index and risk of rheumatoid arthritis: a Mendelian randomization study. Eur J Clin Invest 2019;49:e13076. - PubMed
    1. Bennett MI, Smith BH, Torrance N, Potter J. The S-LANSS score for identifying pain of predominantly neuropathic origin: validation for use in clinical and postal research. J Pain 2005;6:149–58. - PubMed