A non-invasive strategy for suppressing asthmatic airway inflammation and remodeling: Inhalation of nebulized hypoxic hUCMSC-derived extracellular vesicles
- PMID: 37090722
- PMCID: PMC10113478
- DOI: 10.3389/fimmu.2023.1150971
A non-invasive strategy for suppressing asthmatic airway inflammation and remodeling: Inhalation of nebulized hypoxic hUCMSC-derived extracellular vesicles
Abstract
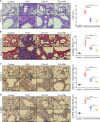
Mesenchymal stromal cell-derived extracellular vesicles (MSC-EVs) are extremely promising nanoscale cell-free therapeutic agents. We previously identified that intravenous administration (IV) of human umbilical cord MSC-EVs (hUCMSC-EVs), especially hypoxic hUCMSC-EVs (Hypo-EVs), could suppress allergic airway inflammation and remodeling. Here, we further investigated the therapeutic effects of Hypo-EVs administration by atomizing inhalation (INH), which is a non-invasive and efficient drug delivery method for lung diseases. We found that nebulized Hypo-EVs produced by the atomization system (medical/household air compressor and nebulizer) maintained excellent structural integrity. Nebulized Dir-labeled Hypo-EVs inhaled by mice were mainly restricted to lungs. INH administration of Hypo-EVs significantly reduced the airway inflammatory infiltration, decreased the levels of IL-4, IL-5 and IL-13 in bronchoalveolar lavage fluid (BALF), declined the content of OVA-specific IgE in serum, attenuated the goblet cell metaplasia, and the expressions of subepithelial collagen-1 and α-smooth muscle actin (α-SMA). Notably, Hypo-EV INH administration was generally more potent than Hypo-EV IV in suppressing IL-13 levels and collagen-1 and α-SMA expressions. RNA sequencing revealed that various biological processes, such as cell adhesion, innate immune response, B cell activation, and extracellular space, were associated with the activity of Hypo-EV INH against asthma mice. In addition, Hypo-EVs could load exogenous miR-146a-5p (miR-146a-5p-EVs). Furthermore, INH administration of miR-146a-5p-EVs resulted in a significantly increased expression of miR-146a-5p mostly in lungs, and offered greater protection against the OVA-induced increase in airway inflammation, subepithelial collagen accumulation and myofibroblast compared with nebulized Hypo-EVs. Overall, nebulized Hypo-EVs effectively attenuated allergic airway inflammation and remodeling, potentially creating a non-invasive route for the use of MSC-EVs in asthma treatment.
Keywords: asthma; extracellular vesicles; inhalation device; lung injury; mesenchymal stem cells; nebulized administration.
Copyright © 2023 Xu, Wang, Luo, Gao, Gu, Ma, Xu, Yu, Liu, Liu, Wang, Zheng, Mao and Dong.
Conflict of interest statement
The authors declare that the research was conducted in the absence of any commercial or financial relationships that could be construed as a potential conflict of interest.
Figures


Similar articles
-
Hypoxic hUCMSC-derived extracellular vesicles attenuate allergic airway inflammation and airway remodeling in chronic asthma mice.Stem Cell Res Ther. 2021 Jan 6;12(1):4. doi: 10.1186/s13287-020-02072-0. Stem Cell Res Ther. 2021. PMID: 33407872 Free PMC article.
-
MiR-146a engineered extracellular vesicles derived from mesenchymal stromal cells more potently attenuate ischaemia-reperfusion injury in lung transplantation.Clin Transl Med. 2025 Apr;15(4):e70298. doi: 10.1002/ctm2.70298. Clin Transl Med. 2025. PMID: 40195092 Free PMC article.
-
MiR-146a-5p engineered hucMSC-derived extracellular vesicles attenuate Dermatophagoides farinae-induced allergic airway epithelial cell inflammation.Front Immunol. 2024 Sep 19;15:1443166. doi: 10.3389/fimmu.2024.1443166. eCollection 2024. Front Immunol. 2024. PMID: 39364406 Free PMC article.
-
Crucial Role of Extracellular Vesicles in Bronchial Asthma.Int J Mol Sci. 2019 May 27;20(10):2589. doi: 10.3390/ijms20102589. Int J Mol Sci. 2019. PMID: 31137771 Free PMC article. Review.
-
From mesenchymal stem cells to their extracellular vesicles: Progress and prospects for asthma therapy.Asian J Pharm Sci. 2024 Aug;19(4):100942. doi: 10.1016/j.ajps.2024.100942. Epub 2024 Jul 9. Asian J Pharm Sci. 2024. PMID: 39253613 Free PMC article. Review.
Cited by
-
Extracellular Vesicles in Asthma: Intercellular Cross-Talk in TH2 Inflammation.Cells. 2025 Apr 3;14(7):542. doi: 10.3390/cells14070542. Cells. 2025. PMID: 40214495 Free PMC article. Review.
-
Innovative approaches to asthma treatment: harnessing nanoparticle technology.Discov Nano. 2025 Feb 8;20(1):21. doi: 10.1186/s11671-025-04211-z. Discov Nano. 2025. PMID: 39922940 Free PMC article. Review.
-
Nebulized inhalation of extracellular vesicles containing SPOCK2 suppresses lung adenocarcinoma progression via MAPK inhibition.Discov Oncol. 2025 May 17;16(1):797. doi: 10.1007/s12672-025-02626-9. Discov Oncol. 2025. PMID: 40382517 Free PMC article.
-
Advances in the application of extracellular vesicles derived from three-dimensional culture of stem cells.J Nanobiotechnology. 2024 May 1;22(1):215. doi: 10.1186/s12951-024-02455-y. J Nanobiotechnology. 2024. PMID: 38693585 Free PMC article. Review.
-
Nebulization of Hypoxic hUCMSC-EVs Attenuates Airway Epithelial Barrier Defects in Chronic Asthma Mice by Transferring CAV-1.Int J Nanomedicine. 2024 Oct 29;19:10941-10959. doi: 10.2147/IJN.S476151. eCollection 2024. Int J Nanomedicine. 2024. PMID: 39493276 Free PMC article.
References
Publication types
MeSH terms
Substances
LinkOut - more resources
Full Text Sources
Medical
Molecular Biology Databases

