. 2023 Apr 5:14:1164408.
doi: 10.3389/fimmu.2023.1164408. eCollection 2023.

Machine learning-based integration develops an immune-related risk model for predicting prognosis of high-grade serous ovarian cancer and providing therapeutic strategies

Affiliations

Machine learning-based integration develops an immune-related risk model for predicting prognosis of high-grade serous ovarian cancer and providing therapeutic strategies

Qihui Wu et al. Front Immunol. .

Abstract

Background: High-grade serous ovarian cancer (HGSOC) is a highly lethal gynecological cancer that requires accurate prognostic models and personalized treatment strategies. The tumor microenvironment (TME) is crucial for disease progression and treatment. Machine learning-based integration is a powerful tool for identifying predictive biomarkers and developing prognostic models. Hence, an immune-related risk model developed using machine learning-based integration could improve prognostic prediction and guide personalized treatment for HGSOC.

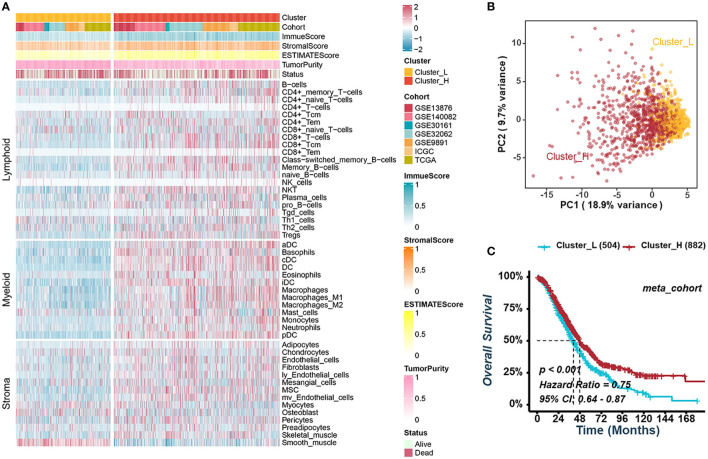
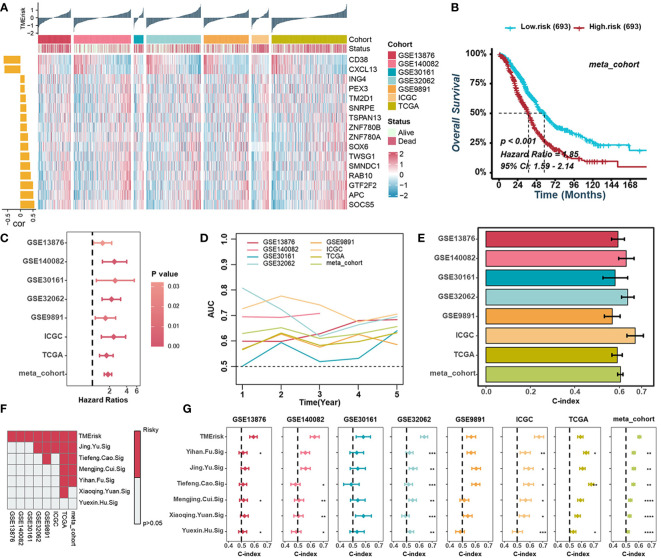
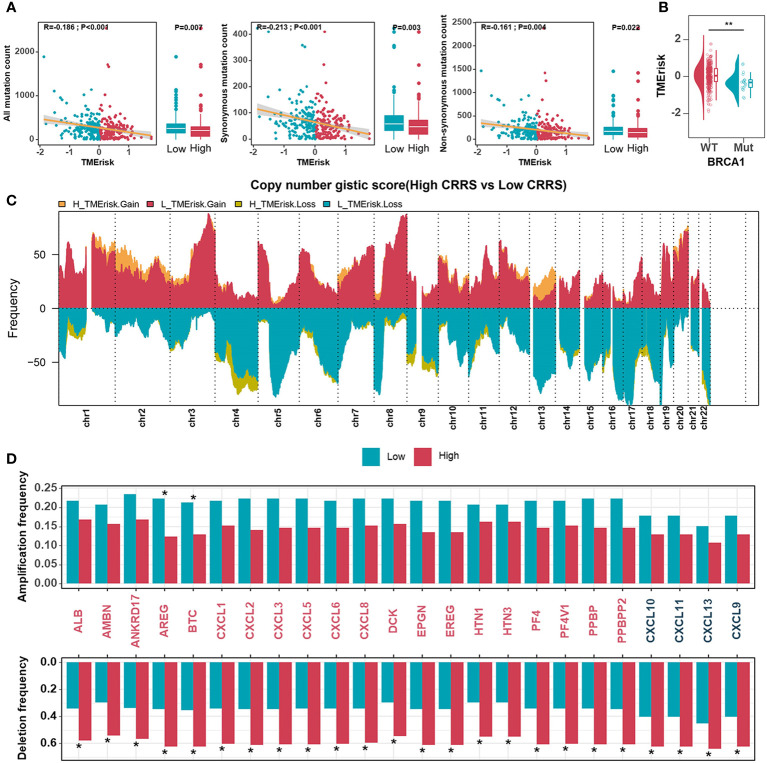
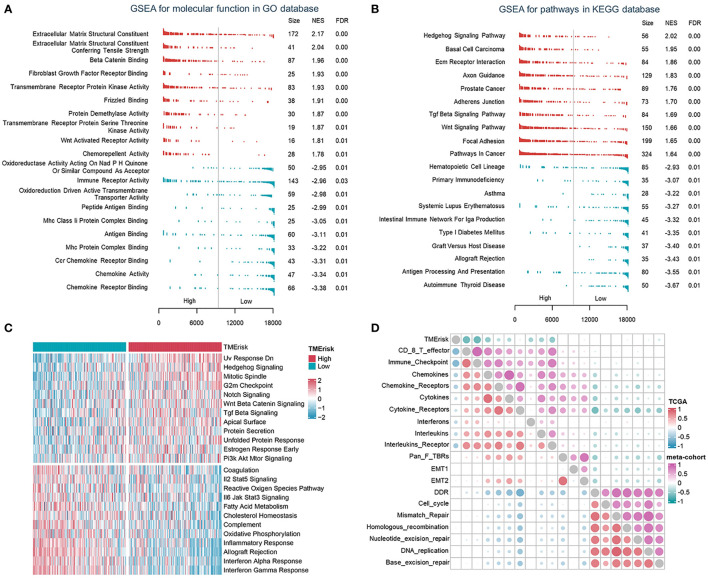
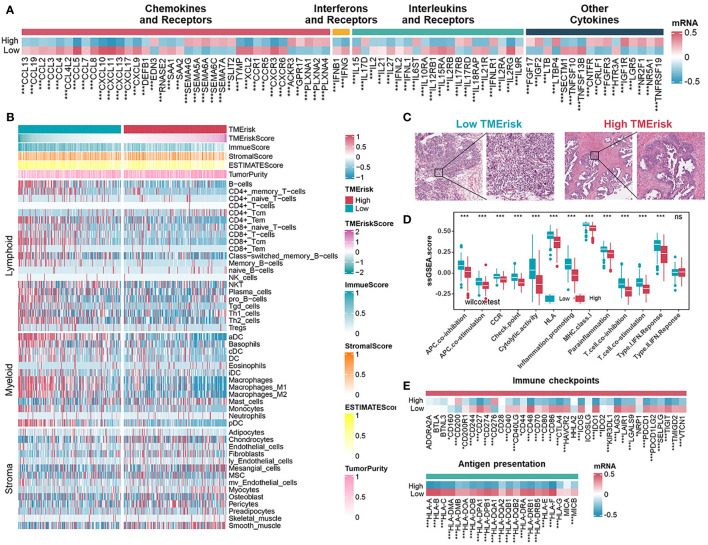
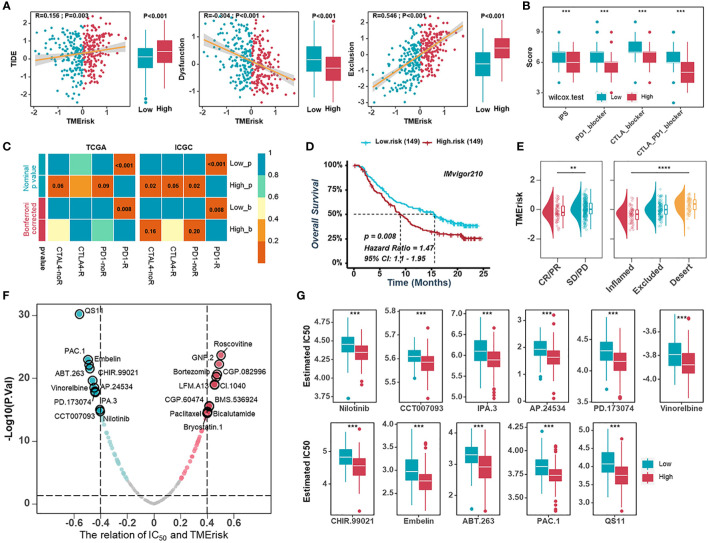
Methods: During the bioinformatic study in HGSOC, we performed (i) consensus clustering to identify immune subtypes based on signatures of immune and stromal cells, (ii) differentially expressed genes and univariate Cox regression analysis to derive TME- and prognosis-related genes, (iii) machine learning-based procedures constructed by ten independent machine learning algorithms to screen and construct a TME-related risk score (TMErisk), and (iv) evaluation of the effect of TMErisk on the deconstruction of TME, indication of genomic instability, and guidance of immunotherapy and chemotherapy.

Results: We identified two different immune microenvironment phenotypes and a robust and clinically practicable prognostic scoring system. TMErisk demonstrated superior performance over most clinical features and other published signatures in predicting HGSOC prognosis across cohorts. The low TMErisk group with a notably favorable prognosis was characterized by BRCA1 mutation, activation of immunity, and a better immune response. Conversely, the high TMErisk group was significantly associated with C-X-C motif chemokine ligands deletion and carcinogenic activation pathways. Additionally, low TMErisk group patients were more responsive to eleven candidate agents.

Conclusion: Our study developed a novel immune-related risk model that predicts the prognosis of ovarian cancer patients using machine learning-based integration. Additionally, the study not only depicts the diversity of cell components in the TME of HGSOC but also guides the development of potential therapeutic techniques for addressing tumor immunosuppression and enhancing the response to cancer therapy.

Keywords: machine learning; ovarian cancer; prognosis; treatment; tumor microenvironment.


Conflict of interest statement

The authors declare that the research was conducted in the absence of any commercial or financial relationships that could be construed as a potential conflict of interest.

Figures

Figure 1
Figure 1
Consensus clustering for TME-infiltrating cells in HGSOC. (A) Heatmap illustrating the infiltration of immune and stromal cells between clusters-L and cluster-H in the meta-cohort. (B) Principal component analysis suggesting two distinct clusters in the meta-cohort. (C) Kaplan-Meier analysis estimating the overall survival between cluster-L and cluster-H.
Figure 2
Figure 2
Construction of the TMErisk score in HGSOC. (A) Heatmap illustrating the expression of 16 TME-related genes and the TMErisk score in low- and high-TMErisk groups. The bar chart on the left illustrates the relationships between TME-related genes and TMErisk score. (B) Kaplan-Meier analysis estimating the overall survival between low- and high-TMErisk groups in meta-cohort. (C) Univariate Cox regression analyses revealing the correlation between TMErisk score and HGSOC survival. (D) Time-dependent AUC value of the TMErisk score in different cohorts. (E) C-index of the TMErisk score in different cohorts. (F) Univariate Cox regression analysis of the TMErisk score and other published signatures across diverse cohorts. (G) C-index of the TMErisk score and other published signatures across diverse cohorts. *P < 0.05; **P < 0.01; ***P < 0.001; ****P < 0.0001.
Figure 3
Figure 3
Genomic states of different TMErisk groups in HGSOC. (A) Boxplots comparing all mutation counts (left), synonymous mutation counts (middle), and non-synonymous mutation counts (right) between low- and high-TMErisk groups, and the correlation between mutation count and the TMErisk score in TCGA-OV cohort. (B) Distribution of TMErisk scores in the BRCA1 mutant and wild-type groups. (C) Gains and losses in copy numbers in groups with low and high TMErisk. (D) Copy number variations at chromosomal bands 4q13.3 and 4q21.1 between low- and high-TMErisk groups. *P < 0.05; **P < 0.01.
Figure 4
Figure 4
The TMErisk score was associated with immune-related pathways in HGSOC. (A, B) Analysis of GO molecular function (A) and KEGG pathway gene sets (B) in the low- and high-TMErisk groups. (C) Analysis of hallmark gene sets in the low- and high-TMErisk groups. (D) The correlations between TMErisk score and immune-related signatures.
Figure 5
Figure 5
Immune landscape of different TMErisk groups in HGSOC. (A) Expression of chemokines, interferons, interleukins, and other cytokines in low- and high-TMErisk groups in TCGA-OV cohort. (B) Heatmap showing the infiltration of immune and stromal cells between low- and high-TMErisk groups in TCGA-OV cohort. (C) CDSA images of representative HE-stained samples of HGSOC from TCGA in low- and high-TMErisk groups. (D, E) Differences in immune-related functions (D), immune checkpoints and HLA gene expression (E) between low- and high-TMErisk groups. nsP > 0.05; *P < 0.05; **P < 0.01; ***P < 0.001
Figure 6
Figure 6
Predictive value of the TMErisk score in immunotherapy and chemotherapy. (A) The correlations between the TMErisk score with TIDE score (left), dysfunction score (middle), and exclusion score (right). (B) The correlation between the TMErisk score and IPS predictor. (C) Submap analyses predicting the probability of immunotherapy responses (anti-PD-1 and anti-CTLA-4) in low- and high-TMErisk groups, in TCGA-OV and ICGC cohort, respectively. (D) Kaplan-Meier analysis estimating the overall survival of low- and high-TMErisk groups in IMvigor210 cohort. (E) The distribution of TMErisk scores across groups with different immune response status (left) and immune phenotypes (right). (F) The relation between the IC50 of candidate drugs and TMErisk scores. (G) Boxplots showing the estimated higher IC50 values of drugs in the low-TMErisk group. **P < 0.01; ***P < 0.001; ****P < 0.0001.

Similar articles

Cited by

References

    1. Siegel RL, Miller KD, Fuchs HE, Jemal A. Cancer statistics, 2022. CA Cancer J Clin (2022) 72(1):7–33. doi: 10.3322/caac.21708 - DOI - PubMed
    1. Vaughan S, Coward JI, Bast RC, Jr., Berchuck A, Berek JS, Brenton JD, et al. . Rethinking ovarian cancer: Recommendations for improving outcomes. Nat Rev Cancer (2011) 11(10):719–25. doi: 10.1038/nrc3144 - DOI - PMC - PubMed
    1. Seidman JD, Horkayne-Szakaly I, Haiba M, Boice CR, Kurman RJ, Ronnett BM. The histologic type and stage distribution of ovarian carcinomas of surface epithelial origin. Int J Gynecol Pathol (2004) 23(1):41–4. doi: 10.1097/01.pgp.0000101080.35393.16 - DOI - PubMed
    1. Tothill RW, Tinker AV, George J, Brown R, Fox SB, Lade S, et al. . Novel molecular subtypes of serous and endometrioid ovarian cancer linked to clinical outcome. Clin Cancer Res (2008) 14(16):5198–208. doi: 10.1158/1078-0432.CCR-08-0196 - DOI - PubMed
    1. Cancer Genome Atlas Research N . Integrated genomic analyses of ovarian carcinoma. Nature (2011) 474(7353):609–15. doi: 10.1038/nature10166 - DOI - PMC - PubMed

Publication types