. 2023 Apr 5:14:1105432.
doi: 10.3389/fimmu.2023.1105432. eCollection 2023.

CD28-signaling can be partially compensated in CD28-knockout mice but is essential for virus elimination in a murine model of multiple sclerosis

Affiliations

CD28-signaling can be partially compensated in CD28-knockout mice but is essential for virus elimination in a murine model of multiple sclerosis

Kirsten Hülskötter et al. Front Immunol. .

Abstract

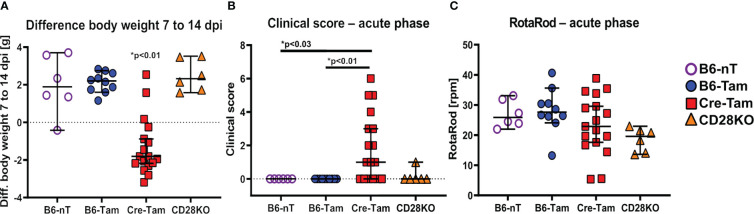
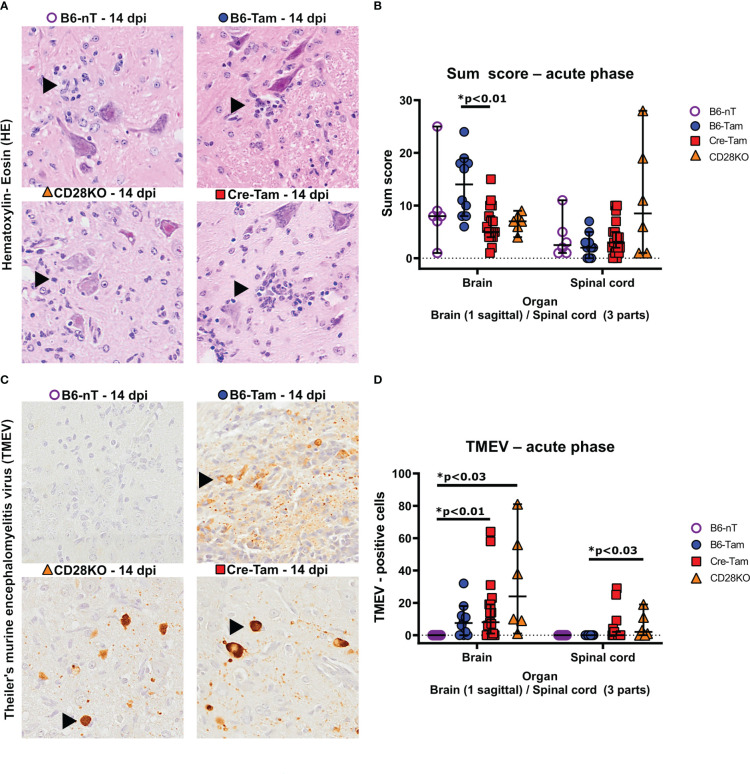
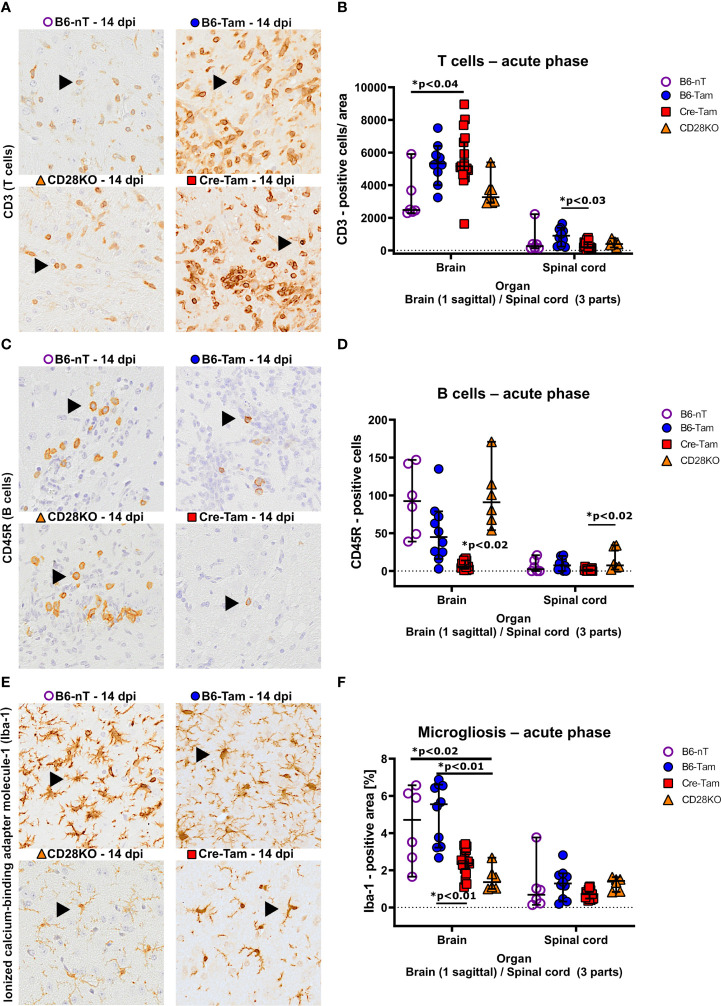
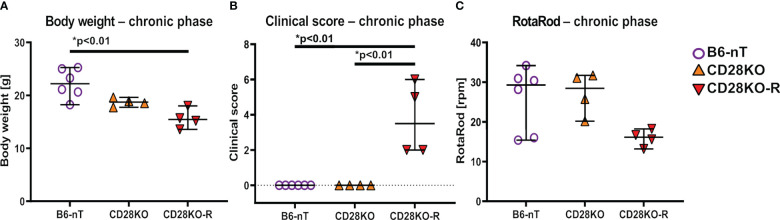
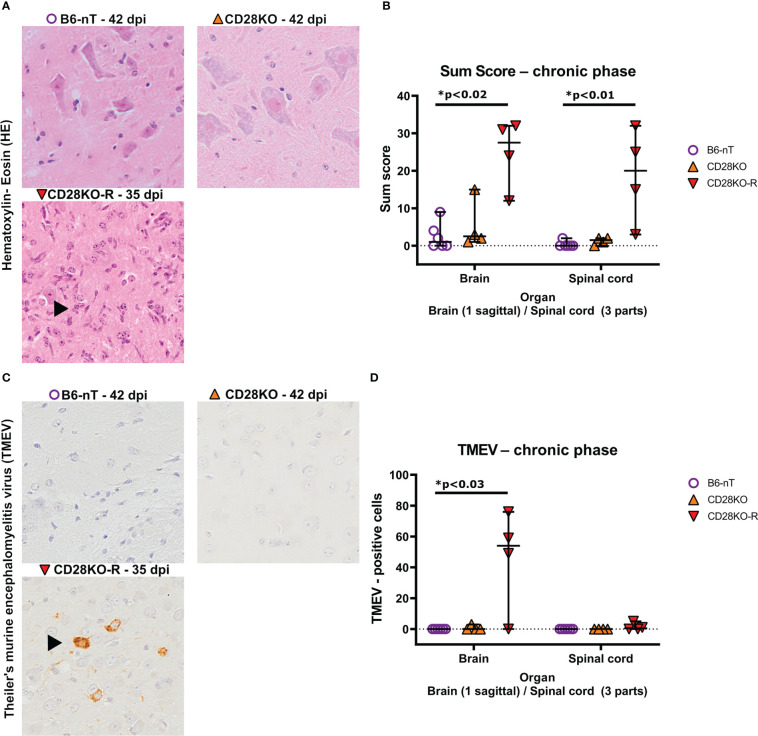
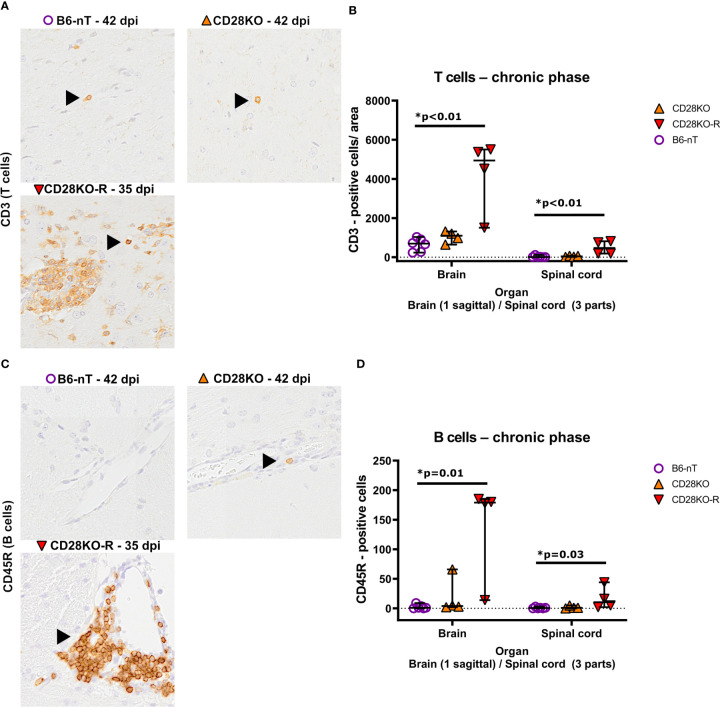
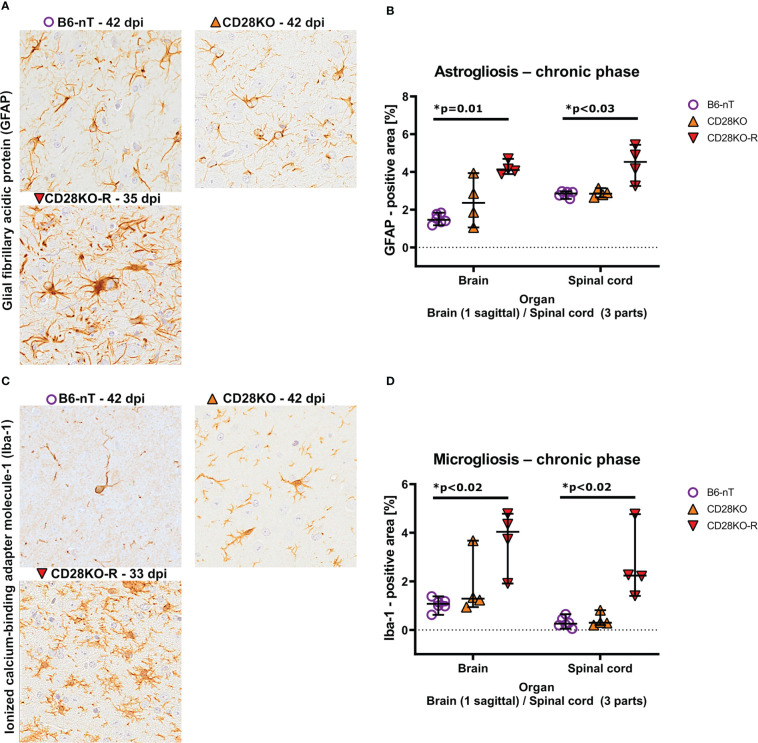
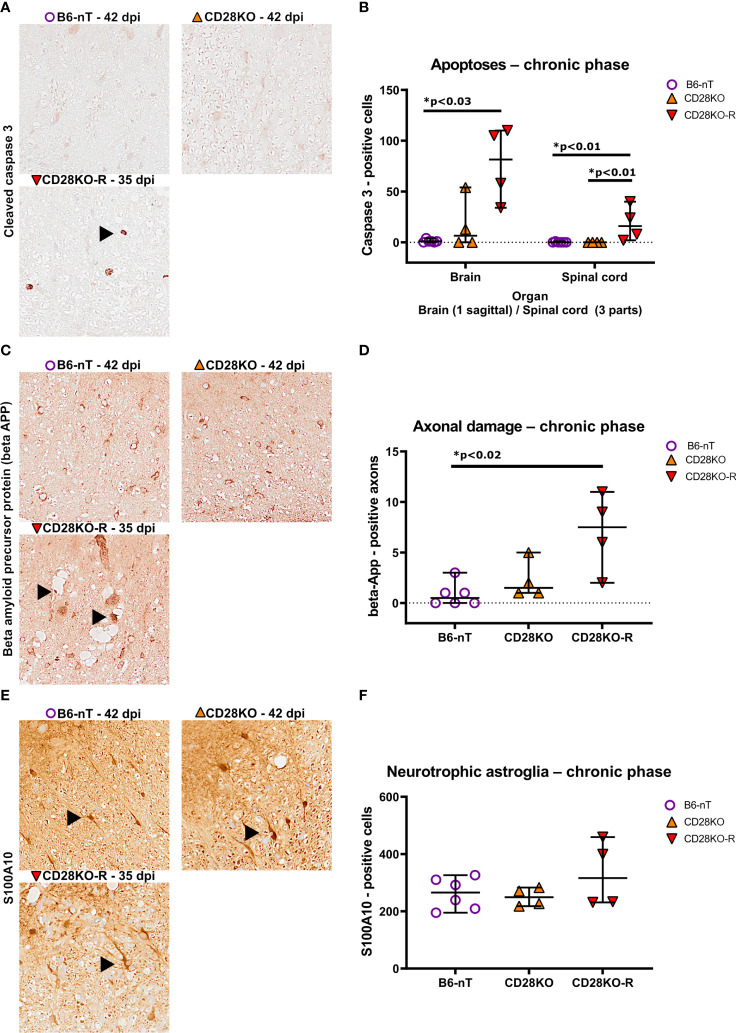
The intracerebral infection of mice with Theiler's murine encephalomyelitis virus (TMEV) represents a well-established animal model for multiple sclerosis (MS). Because CD28 is the main co-stimulatory molecule for the activation of T cells, we wanted to investigate its impact on the course of the virus infection as well as on a potential development of autoimmunity as seen in susceptible mouse strains for TMEV. In the present study, 5 weeks old mice on a C57BL/6 background with conventional or tamoxifen-induced, conditional CD28-knockout were infected intracerebrally with TMEV-BeAn. In the acute phase at 14 days post TMEV-infection (dpi), both CD28-knockout strains showed virus spread within the central nervous system (CNS) as an uncommon finding in C57BL/6 mice, accompanied by histopathological changes such as reduced microglial activation. In addition, the conditional, tamoxifen-induced CD28-knockout was associated with acute clinical deterioration and weight loss, which limited the observation period for this mouse strain to 14 dpi. In the chronic phase (42 and 147 dpi) of TMEV-infection, surprisingly only 33% of conventional CD28-knockout mice showed chronic TMEV-infection with loss of motor function concomitant with increased spinal cord inflammation, characterized by T- and B cell infiltration, microglial activation and astrogliosis at 33-42 dpi. Therefore, the clinical outcome largely depends on the time point of the CD28-knockout during development of the immune system. Whereas a fatal clinical outcome can already be observed in the early phase during TMEV-infection for conditional, tamoxifen-induced CD28-knockout mice, only one third of conventional CD28-knockout mice develop clinical symptoms later, accompanied by ongoing inflammation and an inability to clear the virus. However, the development of autoimmunity could not be observed in this C57BL/6 TMEV model irrespective of the time point of CD28 deletion.

Keywords: Theiler’s murine encephalomyelitis virus (TMEV); conditional CD28-knockout; conventional CD28-knockout; immunology & infectious diseases; multiple sclerosis (MS) disease; neuroimmunology and neuropathology.


Conflict of interest statement

The authors declare that the research was conducted in the absence of any commercial or financial relationships that could be construed as a potential conflict of interest.

Figures

Figure 1
Figure 1
(A-C) Assessment of general parameters and clinical score during the acute phase of a Theiler’s murine encephalomyelitis virus (TMEV)-infection at 14 days post infection (dpi). (A) Mice with tamoxifen-induced CD28-knockout (Cre-Tam, n=17) show a significant loss of the body weight within the second week of infection (7 to 14 dpi). (B) At 14 dpi, the clinical score of Cre-Tam mice (n=17) is significantly increased compared to B6-nT (n=6) and B6-Tam (n=10) controls. (C) RotaRod-performance was similar and lacked significant differences between the groups at 14 dpi. Graphs show scatter plots (one dot per animal) with median (black bar) and 95% confidence intervals (black error bars). Statistically significant p-values are depicted within the graphs (Kruskal-Wallis test followed by Dunn-Bonferroni post-hoc test and significance level correction for multiple testing).
Figure 2
Figure 2
(A, B) Semi-quantitative scores of the brains and spinal cords of TMEV-infected B6-nT mice (no CD28-knockout, no tamoxifen application, n=6), B6-Tam mice (no CD28-knockout, tamoxifen application, n=10), CD28KO mice (CD28-knockout, no tamoxifen application, n=6) and Cre-Tam mice (CD28-knockout, tamoxifen application, n=17) using hematoxylin-eosin (HE) stained sections in the acute phase at 14 days post infection (dpi). (A) Representative pictures showing inflammatory infiltrates (arrowheads) within the lumbar spinal cords in Theiler’s murine encephalomyelitis virus (TMEV) infected mice at 14 dpi. (B) Summarized graphical presentation of semi-quantitative scores obtained in 10 brain regions and 6 spinal cord regions at 14 dpi, showing significantly lower scores within the brains of CD28-knockout (Cre-Tam) mice compared to B6-Tam controls and similar scores within the spinal cord. (C, D) Immunohistochemical detection of TMEV-antigen within the brains and spinal cords of TMEV-infected mice at 14 dpi. (C) Representative pictures showing no TMEV-antigen in B6-nT mice (upper left) and persisting TMEV-antigen within the hippocampus (B6-Tam, upper right) and cerebral cortex (CD28KO, lower left; Cre-Tam, lower right) at 14 dpi. (D) In contrast to B6-nT-control animals, mice with tamoxifen application (B6-Tam) as well as mice with CD28-knockout (Cre-Tam, CD28KO) showed virus antigen in the brain at 14 dpi. Virus spread into the spinal cord was only detected in mice with CD28-knockout (Cre-Tam, CD28KO) and reached statistically significance between CD28KO mice and B6-Tam controls. Graphs show scatter plots (one dot per animal) with median (black bar) and 95% confidence intervals (black error bars). Statistically significant p-values are depicted within the graphs (Kruskal-Wallis test followed by Dunn-Bonferroni post-hoc test and significance level correction for multiple testing).
Figure 3
Figure 3
(A, B) Immunohistochemical detection of CD3-positive T cell infiltration into the brain and spinal cord of Theiler’s murine encephalomyelitis virus (TMEV)-infected B6-nT mice (no CD28-knockout, no tamoxifen application, n=6), B6-Tam mice (no CD28-knockout, tamoxifen application, n=10), CD28KO mice (CD28-knockout, no tamoxifen application, n=6) and Cre-Tam mice (CD28-knockout, tamoxifen application, n=17) in the acute phase at 14 days post infection (dpi). (A) Representative pictures showing moderate T cell infiltration (arrowheads) into the thalamus of B6-nT (upper left) and CD28KO mice (lower left) in contrast to high numbers of infiltrating T cells in B6-Tam (upper right) and Cre-Tam mice (lower right) at 14 dpi. (B) Quantitative evaluation of T cells per area (0.5 cm² brain, 0.07cm² spinal cord) reveals increased infiltration into the brain of Cre-Tam compared to B6-nT controls and spinal cord of B6-Tam mice, compared to Cre-Tam mice. (C, D) Infiltration of CD45R-positive B cells into the brain and spinal cord of TMEV-infected mice at 14 dpi. (C) Representative pictures showing moderate infiltration of B cells (arrowheads) into the hippocampus of TMEV-infected B6-nT (upper left) and CD28KO mice (lower left) in contrast to low numbers of infiltrating B cells in B6-Tam (upper right) and Cre-Tam mice (lower right) at 14 dpi. (C) Quantitative analysis shows significantly decreased B cell infiltration in the brain of Cre-Tam mice compared to all other groups. Within the spinal cord, B cell numbers are significantly lower in Cre-Tam mice, compared to CD28KO mice at 14 dpi. (E, F) Analysis of microgliosis within the brain and spinal cord of TMEV-infected mice at 14 dpi. (E) Representative pictures of activated, ionized calcium-binding adapter molecule-1 (Iba-1)-positive microglia/macrophages within the thalamus, showing increased cell numbers and ramification in B6-nT (upper left) and B6-Tam mice (upper right) in contrast to lower cell numbers with only few cell processes in CD28KO (lower left) and Cre-Tam mice (lower right) at 14 dpi. (F) A detailed analysis of Iba-1 positive areas reveals significantly decreased microgliosis within the brain of CD28-knockout mice (Cre-Tam, CD28KO) compared to controls (B6-nT, B6-Tam) at 14 dpi. Within the spinal cord, there is no difference at 14 dpi concerning microgliosis. Graphs show scatter plots (one dot per animal) with median (black bar) and 95% confidence intervals (black error bars). Statistically significant p-values are depicted within the graphs (Kruskal-Wallis test followed by Dunn-Bonferroni post-hoc test and significance level correction for multiple testing).
Figure 4
Figure 4
(A–C) Assessment of general parameters and clinical score during the chronic phase of Theiler’s murine encephalomyelitis virus (TMEV)-infection. TMEV-infected conventional CD28-knockout mice with clinical signs in the chronic phase, termed ‘responder CD28KO’ mice, (CD28KO-R, n=4) were euthanized at 33 (n=1), 35 (n=1) and 42 dpi (n=2) and compared to CD28-knockout mice without clinical signs (CD28KO, n=4) and control mice without knockout (B6-nT, n= 6) that were sacrificed on 42 dpi. (A) CD28KO-R mice show a significantly lower body weight at the end of experiment, compared to B6-nT controls. (B) B6-nT and CD28KO mice do not show a clinical score at 42 dpi. The clinical scores of CD28KO-R mice (n=4) are elevated significantly at the end of experiment at 33, 35 and 42 dpi, respectively. (C) RotaRod performance tests show a mildly reduced performance of CD28KO-R mice compared to CD28KO mice, that however reaches no statistical significance (p= 0.104). Graphs show scatter plots (one dot per animal) with median (black bar) and 95% confidence intervals (black error bars). Statistically significant p-values are depicted within the graphs (Kruskal-Wallis test followed by Dunn-Bonferroni post-hoc test and significance level correction for multiple testing).
Figure 5
Figure 5
(A, B) Semi-quantitative scoring of brain and spinal cord on hematoxylin-eosin (HE) stained sections in the chronic phase at 33, 35 or 42 days post infection (dpi), respectively. Theiler’s murine encephalomyelitis virus (TMEV)-infected CD28-knockout mice with clinical signs in the chronic phase, termed ‘responder CD28KO’ mice, (CD28KO-R, n=4) were euthanized at 33 (n=1), 35 (n=1) and 42 dpi (n=2) and compared to CD28-knockout mice without clinical signs (CD28KO, n=4) and control mice without knockout (B6-nT, n= 6) that were sacrificed on 42 dpi. (A) Representative pictures of lumbar spinal cord of TMEV-infected mice showing lack of inflammatory changes in B6-nT (upper left) and CD28KO mice without clinical signs (upper right) in contrast to ongoing inflammation (arrowhead) in the spinal cord of a CD28KO-R mouse at 35 dpi (lower left). (B) Semi-quantitative scores representing the total sum obtained by added scores of 10 different brain- or 6 spinal cord regions, respectively, showed significantly increased scores in the brain and spinal cord of CD28KO-R mice compared to B6-nT controls in the chronic phase of TMEV-infection. (C, D) Immunohistochemical analysis of TMEV-antigen within the brain and spinal cords of mice in the chronic phase of TMEV-infection. (C) Representative pictures lack TMEV-antigen in B6-nT control mice (upper left) and CD28KO mice without clinical signs (upper right) in contrast to persisting TMEV-antigen within the cerebral cortex of a CD28KO-R mouse at 35 dpi (lower left). (D) Quantitative analysis revealed TMEV-persistence within the brain and spinal cord of CD28KO-R mice. Graphs show scatter plots (one dot per animal) with median (black bar) and 95% confidence intervals (black error bars). Statistically significant p-values are depicted within the graphs (Kruskal-Wallis test followed by Dunn-Bonferroni post-hoc test and significance level correction for multiple testing).
Figure 6
Figure 6
(A, B) Immunohistochemical analysis of CD3-positive T cell infiltration into the brain and spinal cord of Theiler’s murine encephalomyelitis virus (TMEV)-infected mice in the chronic phase at 33, 35 and 42 days post infection (dpi), respectively. TMEV-infected conventional CD28-knockout mice with clinical signs in the chronic phase, termed ‘responder CD28KO’ mice, (CD28KO-R, n=4) were euthanized at 33 (n=1), 35 (n=1) and 42 dpi (n=2) and compared to CD28-knockout mice without clinical signs (CD28KO, n=4) and control mice without knockout (B6-nT, n= 6) that were sacrificed on 42 dpi. (A) Representative pictures showing single CD3-positive T cells within the hypothalamus (B6-nT, upper left)) and thalamus (CD28KO, upper right) in contrast to increased T cell infiltration into the thalamus of a TMEV-infected CD28KO-R mouse (lower left) at 35 and 42 dpi, respectively. (B) Quantitative evaluation of T cells per area (0.5 cm² brain, 0.07cm² spinal cord) shows, compared to B6-nT controls at 42 dpi, a significantly increased T cell infiltration into the brain and spinal cord of CD28KO-R mice at 33, 35 and 42 dpi, respectively. (C-D) Immunohistochemical analysis of CD45R-positive B cell infiltration into the brain and spinal cord of TMEV-infected mice in the chronic phase at 33, 35 and 42 dpi, respectively. (C) Representative pictures of CD45R-positive B cells (arrowheads) within the hypothalamus, showing no B cells in a B6-nT (upper left) or single perivascular B cells in a CD28KO mouse (upper right), in contrast to increased perivascular infiltration in a CD28KO-R mouse at 35 dpi (lower left). (B) Quantitative analysis of B cell infiltration shows significantly increased numbers of B cells within the brain and spinal cord of CD28KO-R mice at 33, 35 and 42 dpi, compared to B6-nT controls at 42 dpi. Graphs show scatter plots (one dot per animal) with median (black bar) and 95% confidence intervals (black error bars). Statistically significant p-values are depicted within the graphs (Kruskal-Wallis test followed by Dunn-Bonferroni post-hoc test and significance level correction for multiple testing).
Figure 7
Figure 7
(A, B) Immunohistochemical analysis of glial fibrillary acidic protein (GFAP)-positive astroglia (astrogliosis) within the brain and spinal cord of Theiler’s murine encephalomyelitis virus (TMEV)-infected mice in the chronic phase at 33, 35 and 42 days post infection (dpi), respectively. TMEV-infected conventional CD28-knockout mice with clinical signs in the chronic phase, termed ‘responder CD28KO’ mice, (CD28KO-R, n=4) were euthanized at 33 (n=1), 35 (n=1) and 42 dpi (n=2) and compared to CD28-knockout mice without clinical signs (CD28KO, n=4) and control mice without knockout (B6-nT, n= 6) that were sacrificed on 42 dpi. (A) Representative pictures of GFAP-positive astroglia (arrowheads) within the thalamus of TMEV-infected mice, showing moderate numbers of astroglia with few processes in the brains of B6-nT (upper left) and CD28KO mice (upper right) at 42 dpi in contrast to increased cell size and number of processes in a CD28KO-R mouse (lower left) at 35 dpi. (B) Quantitative analysis of GFAP-positive area revealed significantly increased astrogliosis within the brain and spinal cord of CD28KO-R mice compared to B6-nT controls in the chronic phase. (C, D) Analysis of activated, ionized calcium-binding adapter molecule-1 (Iba-1)-positive microglia within the brain and spinal cord of TMEV-infected mice at 33, 35 and 42 dpi, respectively. (C) Representative pictures of Iba-1-psotive microglia/macrophages (arrowheads) within the thalamus of TMEV-infected mice at 33 and 42 dpi showing low cell numbers and few processes in B6-nT (upper left) and CD28KO mice (upper right) at 42 dpi, in contrast to increased ramification of microglia within a CD28KO-R mouse (lower left) at 33 dpi. (D) Quantitative analysis of Iba-1-positive area revealed significantly increased microgliosis within the brain and spinal cord of CD28KO-R mice compared to B6-nT controls. Graphs show scatter plots (one dot per animal) with median (black bar) and 95% confidence intervals (black error bars). Statistically significant p-values are depicted within the graphs (Kruskal-Wallis test followed by Dunn-Bonferroni post-hoc test and significance level correction for multiple testing).
Figure 8
Figure 8
(A, B) Immunohistochemical analysis of cleaved caspase 3-positive, apoptotic cells within the brain and spinal cord of Theiler’s murine encephalomyelitis virus (TMEV)-infected mice in the chronic phase at 33, 35 and 42 days post infection (dpi), respectively. TMEV-infected conventional CD28-knockout mice with clinical signs in the chronic phase termed ‘responder CD28KO’ mice (CD28KO-R, n=4), were euthanized at 33 (n=1), 35 (n=1) and 42 dpi (n=2) and compared to CD28-knockout mice without clinical signs (CD28KO, n=4) and control mice without knockout (B6-nT, n= 6) that were sacrificed on 42 dpi. (A) Representative pictures of the lumbar spinal cord show no apoptoses in B6-nT (upper left) and CD28KO mice (upper right) at 42 dpi in contrast to low numbers of apoptotic cells (arrowhead) in a CD28KO-R mouse (lower left) at 35 dpi. (B) Quantitative analysis of cleaved caspase 3-positive cells revealed significantly increased numbers of apoptoses within the brain and spinal cord of CD28KO-R mice compared to B6-nT controls. (C, D) Immunohistochemical analysis of beta amyloid precursor protein (beta-APP)-positive, damaged axons within the spinal cord of TMEV-infected mice at 33, 35 and 42 dpi. (C) Representative pictures show no damaged axons in B6-nT (upper left) and CD28KO mice (upper right) at 42 dpi, in contrast to the CD28KO-R mouse (lower left) showing small and enlarged beta-APP-positive axons (arrowheads) within dilated myelin sheets in the lumbar spinal cord at 35 dpi. (D) Quantitative analysis of beta-APP-positive axons revealed significantly increased axonal damage within the spinal cord of CD28KO-R mice compared to B6-nT controls. (E, F) Immunohistochemical analysis of S100A10-positive, neurotrophic astroglia within the spinal cord of TMEV-infected mice in the chronic phase at 33, 35 and 42 dpi, respectively. (E) Representative pictures show S100A10-positive astroglia (arrowheads) within the spinal cord of all TMEV-infected mice in the chronic phase of TMEV-infection. (F) Quantitative analysis revealed no significant difference between the groups regarding the number of neurotrophic astroglia in the chronic phase. Graphs show scatter plots (one dot per animal) with median (black bar) and 95% confidence intervals (black error bars). Statistically significant p-values are depicted within the graphs (Kruskal-Wallis test followed by Dunn-Bonferroni post-hoc test and significance level correction for multiple.

Similar articles

References

    1. Gerhauser I, Hansmann F, Ciurkiewicz M, Löscher W, Beineke A. Facets of theiler's murine encephalomyelitis virus-induced diseases: An update. Int J Mol Sci (2019) 20(2):448. doi: 10.3390/ijms20020448 - DOI - PMC - PubMed
    1. Lawley KS, Rech RR, Perez Gomez AA, Hopkins L, Han G, Amstalden K, et al. . Viral clearance and neuroinflammation in acute TMEV infection vary by host genetic background. Int J Mol Sci (2022) 23(18):10482. doi: 10.3390/ijms231810482 - DOI - PMC - PubMed
    1. Brinkmeyer-Langford CL, Rech R, Amstalden K, Kochan KJ, Hillhouse AE, Young C, et al. . Host genetic background influences diverse neurological responses to viral infection in mice. Sci Rep (2017) 7(1):12194–. doi: 10.1038/s41598-017-12477-2 - DOI - PMC - PubMed
    1. Hülskötter K, Jin W, Allnoch L, Hansmann F, Schmidtke D, Rohn K, et al. . Double-edged effects of tamoxifen-in-oil-gavage on an infectious murine model for multiple sclerosis. Brain Pathol (2021) 31 (6):e12994. doi: 10.1111/bpa.12994 - DOI - PMC - PubMed
    1. Zhang J, Lipton HL, Perelson AS, Dahari H. Modeling the acute and chronic phases of theiler murine encephalomyelitis virus infection. J virology (2013) 87(7):4052–9. doi: 10.1128/JVI.03395-12 - DOI - PMC - PubMed

Publication types