. 2023 Apr 6:14:1094694.
doi: 10.3389/fimmu.2023.1094694. eCollection 2023.

The small molecule inhibitor BX-795 uncouples IL-2 production from inhibition of Th2 inflammation and induces CD4+ T cells resembling iTreg

Affiliations

The small molecule inhibitor BX-795 uncouples IL-2 production from inhibition of Th2 inflammation and induces CD4+ T cells resembling iTreg

Peter A Tauber et al. Front Immunol. .

Abstract

Background: Treg cells have been shown to be an important part of immune-homeostasis and IL-2 which is produced upon T cell receptor (TCR)-dependent activation of T lymphocytes has been demonstrated to critically participate in Treg development.

Objective: To evaluate small molecule inhibitors (SMI) for the identification of novel IL-2/Treg enhancing compounds.

Materials and methods: We used TCR-dependent and allergen-specific cytokine secretion of human and mouse T cells, next generation messenger ribonucleic acid sequencing (RNA-Seq) and two different models of allergic airway inflammation to examine lead SMI-compounds.

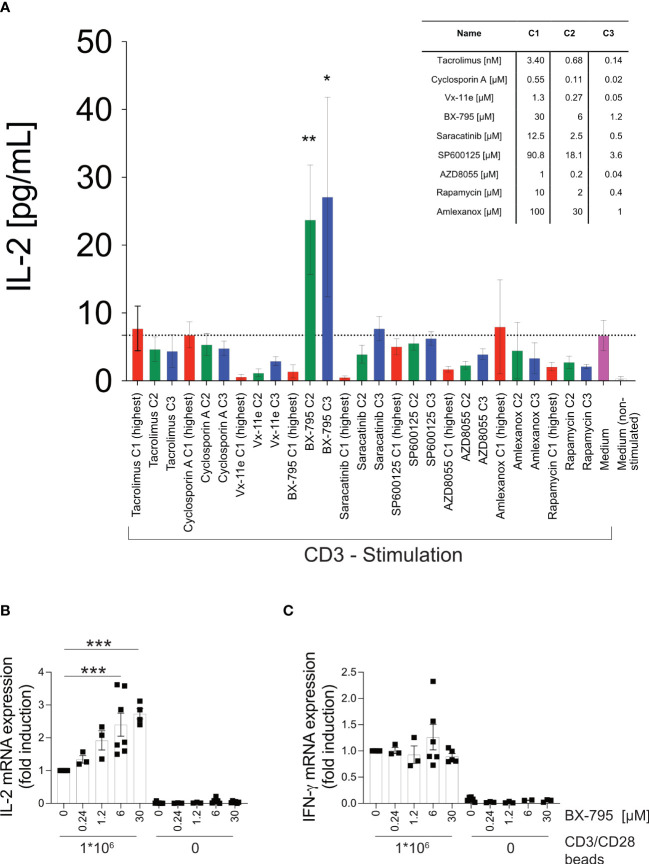
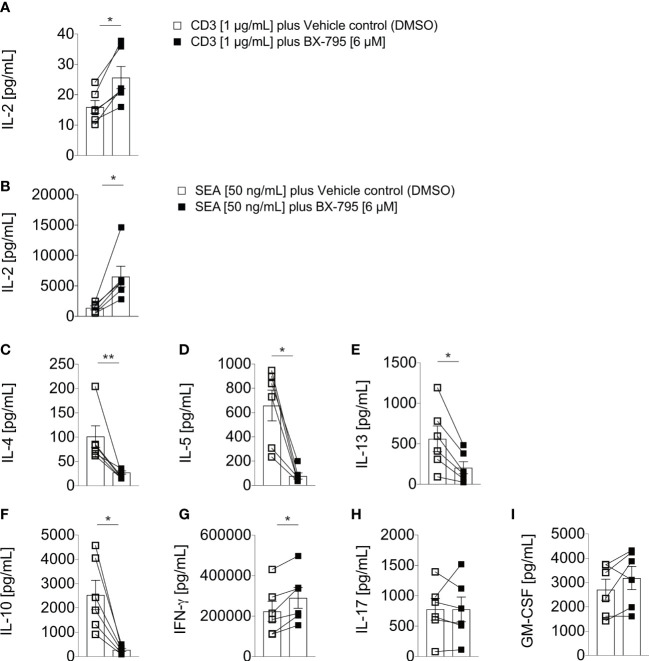
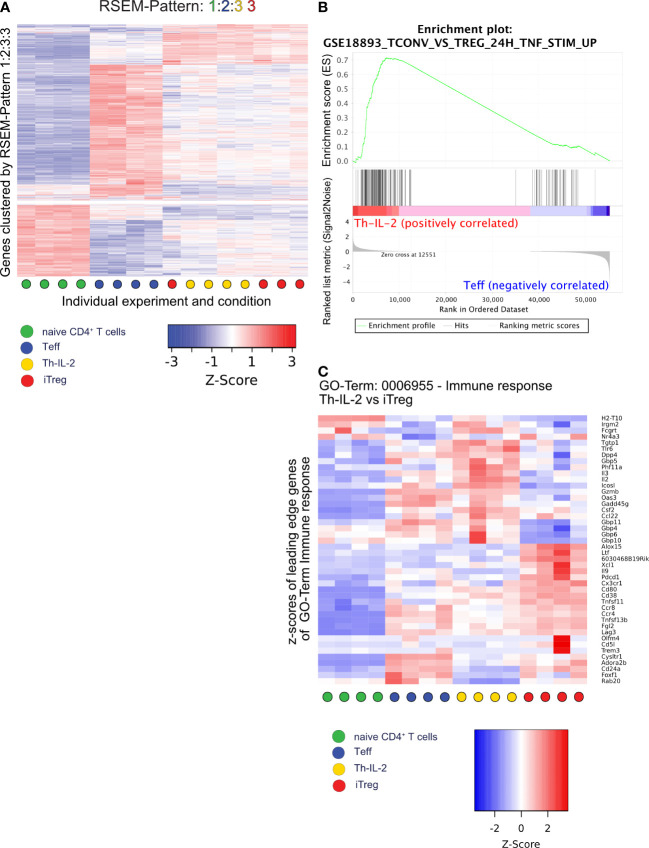
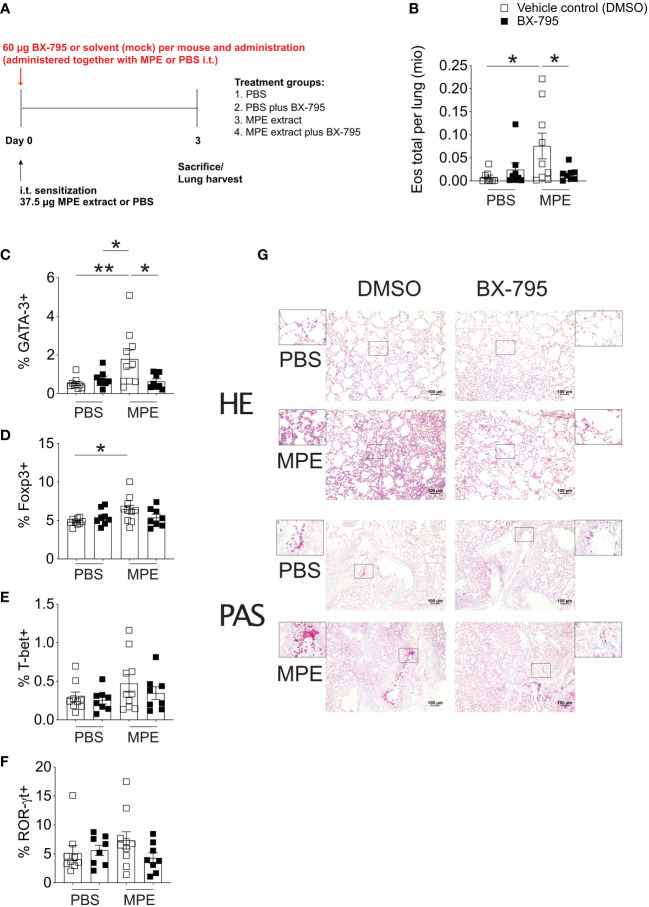
Results: We show here that the reported 3-phosphoinositide dependent kinase-1 (PDK1) SMI BX-795 increased IL-2 in culture supernatants of Jurkat E6-1 T cells, human peripheral blood mononuclear cells (hPBMC) and allergen-specific mouse T cells upon TCR-dependent and allergen-specific stimulation while concomitantly inhibiting Th2 cytokine secretion. RNA-Seq revealed that the presence of BX-795 during allergen-specific activation of T cells induces a bona fide Treg cell type highly similar to iTreg but lacking Foxp3 expression. When applied in mugwort pollen and house dust mite extract-based models of airway inflammation, BX-795 significantly inhibited Th2 inflammation including expression of Th2 signature transcription factors and cytokines and influx into the lungs of type 2-associated inflammatory cells such as eosinophils.

Conclusions: BX-795 potently uncouples IL-2 production from Th2 inflammation and induces Th-IL-2 cells, which highly resemble induced (i)Tregs. Thus, BX-795 may be a useful new compound for the treatment of allergic diseases.

Keywords: IL-2; Immunomodulation; Th2 cells; allergy; regulatory T cells; small molecule inhibitor.


Conflict of interest statement

With regards to the authors disclosure of potential conflicts of interest we would like to indicate that WP received honoraria from Novartis, Astra Zeneca and Roche, GSK and Bristol-Myers Squibb outside the submitted work and GG reports receiving personal fees from Bencard, outside the submitted work. The remaining authors declare that the research was conducted in the absence of any commercial or financial relationships that could be construed as a potential conflict of interest.

Figures

Figure 1
Figure 1
T cell activation studies identify BX-795 as a novel, IL-2 enhancing SMI which acts independently of accessory cells. Shown are (A), IL-2 levels in supernatants of Jurkat E6-1 cells (1x10⁵ cells/well) incubated in 96-well flat bottom plates in the presence (colored bars) or absence (white bar) of plate-bound CD3 mAb OKT3 in the presence (red, green, blue) or absence (magenta and white bar) of the indicated SMI applied at the indicated final concentrations C1 – C3 (see inset table, C1 red, C2 green, C3 blue). All conditions contained DMSO at a final concentration of 0.25% (v/v). Shown are relative (B), IL-2 and (C), IFN-γ mRNA expression levels as assessed by RT-qPCR of Jurkat E6-1 cells (1x10⁶ cells/well in a 48 well plate, 400 µL final volume) incubated in the presence or absence of CD3/CD28 beads (1x10⁶ beads/well) and the indicated concentrations of BX-795 for 6 hours in 400 µL final volume. Specific mRNA levels were first normalized to the housekeeping gene β-2 microglobulin (β2M) and then normalized to the mean of the CD3/CD28 beads stimulated DMSO condition for each respective experiment. All conditions contained DMSO at a final concentration of 0.25% (v/v). Data show in A, mean values ± SEM of four independently performed experiments (except three for rapamycin, and two for amlexanox) tested in triplicates and in B, the summary (means ± SEM) of seven (except 3 for 0.24 and 1.2 µM; 4 for CD3/CD28 at 30 µM; and 6 for unstimulated 6 and 30 µM) independently performed experiments is shown. In (C), the summary (means ± SEM) of six (except 5 for 30 µM; 3 for 0.24 and 1.2 µM; and 2 for unstimulated at 6 µM) are shown. One-way ANOVA with Dunnett’s correction for multiple comparisons (A), comparing all conditions against CD3 stimulated cells in solvent (mean of CD3 stimulated control indicated by dotted line) and (B, C), comparing the respective stimulated and BX-795 treated condition to the stimulated condition which was treated with solvent only. Statistically significant changes are indicated with *, p < 0.05; **, p < 0.01; ***, p < 0.001.
Figure 2
Figure 2
BX-795 stimulates IL-2 but inhibits Th2 effector cytokine secretion in primary human peripheral blood T cells. Shown are (A, B), IL-2; (C), IL-4; (D), IL-5; (E), IL-13; (F), IL-10; (G), IFN-γ; (H), IL-17; and (I), GM-CSF; levels in supernatants of human PBMC (1x10⁵/well) which were stimulated in 96-well round bottom tissue culture plates with soluble 1 µg/mL CD3 mAb in A, or 50 ng/mL SEA in B to I in the presence or absence of 6 µM BX-795 for 72 hours. All cultures contained DMSO at a final concentration of 0.25% (v/v). Shown are A to I, the summaries (mean values ± SEM) of secreted cytokine levels obtained with PBMC of six unrelated healthy individuals analyzed in two independently performed experiments. The non-stimulated baseline levels for the indicated cytokines for medium plus DMSO and medium plus BX-795 solubilized in DMSO were (mean ± SEM): IL-2: 10.1 ± 3.1 and 8.8 ± 3.7; IL-4: 23.5 ± 2.6 and 26.7 ± 3.3; IL-5: 1.6 ± 1.0 and 0.8 ± 0.1; IL-13: 3.9 ± 1.8 and 2.3 ± 0.5; IL-10, 6.9 ± 1.3 and 8.8 ± 1.8; IFN-γ: 233.7 ± 63.9 and 111.3 ± 43.0; IL-17A: 1.2 ± 0.3 and 1.2 ± 0.2 and GM-CSF: 16.0 ± 3.9 and 7.9 ± 3.2; respectively. Paired two-tailed Mann-Whitney U-test. Only statistically significant changes are indicated with *, p < 0.05; **, p < 0.01.
Figure 3
Figure 3
Transcriptomic analyses of naïve T cells activated allergen-specifically in the presence of BX-795 reveals a Th-IL-2 cell phenotype which is distinct from but has close similarities with iTregs. (A), shown is the experimental scheme for allergen-specific T cell activation. For each experimental condition and the numbers of experiments performed a colored dot is assigned. (B), shown are representative FACS plots of freshly sorted naïve (0 h) and differentially activated (120 h) CD3+CD4+ T cells upon culture at the conditions shown in (A). (C), shown are the results of the principal component analyses (PCA) of the RNA-Seq data derived from viable and naïve (0 h) and differentially activated (120 h) CD3+CD4+ T cells according to (A). Colors indicate the respective experimental condition, dots the results of the independently performed experiments. (D), shown are bar graphs (mean values ± SEM) summarizing the expression of selected genes for the four experimental conditions as transcripts per million (TPM). Data shown are representative for one out of 4 experiments in (B) and show the mean value ± SEM of four independently performed experiments in (D). In (D), statistical analysis was performed with one-way ANOVA with Dunnett’s correction of multiple comparisons. All comparisons performed against the condition Th-IL-2. (E), shown is a heat-map displaying the expression of manually curated T helper cell signature genes. Statistically significant changes are indicated with *, p < 0.05; **, p < 0.01; ***, p < 0.001. ns, non-significant.
Figure 4
Figure 4
RSEM, GSEA and GO analysis identify features similar and dissimilar between Th-IL-2, iTreg and Teff. A total of 9845 protein coding genes were assigned to patterns of differential gene expression between the four experimental conditions using the rsem-run-ebseq function of the RSEM toolkit. Each gene can be part of one pattern only. Same numbers for different experimental conditions indicate similar expression of the genes in the respective pattern. Different numbers indicate significantly different gene expression between the respective experimental conditions The order of numbers assigned is shown by the condition-specific colors (indicated in the legend) on top of each heatmap/graph. (A), heatmap of z-scores generated by the limma coolmap function of those 2052 genes which are similarly expressed in Th-IL-2 and iTreg cells, but have differential expression between naïve and Teff cells (pattern 1:2:3:3). (B), gene set enrichment analysis (GSEA) plot of a gene set specific for Tregs after TNF-α stimulation comparing Th-IL-2 to Teff. (C), heatmap showing the relative gene expression levels (z-scores) of genes identified as leading edge subset in the GO term “GO:0006955 Immune response” in an overrepresentation analysis performed by clusterProfiler/enrichGO comparing the Th-IL-2 and iTreg cell groups of samples. Based on the previous DESeq2 analysis, only genes with a log2-fold-change between Th-IL-2 and iTreg of >1 were selected as input for clusterProfiler/enrichGO. Sample group membership is indicated along the x-axis according to Figure 3A .
Figure 5
Figure 5
IL-2 secreted by Th-IL-2 cells is biologically active. (A, B), bar graphs show the percentages of CD73+ (left panel) and CD39+ (right panel) CD3+CD4+ T cells as determined by flow-cytometry for each indicated condition. Briefly, naïve CD4+ T cells [1x10⁵/well] from double transgenic allergy mice were co-cultured with BMDCs [2x10⁴/well] and recombinant Art v 1 protein [1 µg/mL] in the presence or absence of BX-795 [0.24 µM]. Blocking-antibodies against IL-2 and/or TGF-β were added at the beginning of the 120 h incubation period at a final concentration of 10 µg/mL in combinations as indicated. Presence of the respective blocking antibody is indicated by a “+”, replacement of the antibody by its isotype control at a concentration of 10 µg/mL is indicated by a “-”. After 120 hours, cells were stained with fluorophore-conjugated antibodies and analyzed by flow-cytometry. (C), Representative FACS plots of the experiments performed in (A, B) are shown. Numbers indicate percent cells in the respective quadrants. The presence or absence of blocking antibodies is indicated on the left-hand side of each set of contour plots. Data show (A, B), mean values ± SEM of three independently performed experiments. (A, B), one-way ANOVA with Tukey’s post-hoc analysis comparing each condition with each other. The p-values are indicated by *, p < 0.05; **, p < 0.01; ***, p < 0.001. ns, non-significant.
Figure 6
Figure 6
BX-795 ameliorates Th2 inflammation in a murine model of mugwort allergy. (A), shown is the treatment protocol indicating the time points and dosage of mugwort-pollen extract (MPE) or sham treatment (PBS) and concomitant BX-795 exposure of mugwort-specific TCR/DR1 double transgenic C57BL/6 mice. All conditions contained the same amounts of solvent (DMSO). (B), shown are the absolute numbers of eosinophils expressed as 1x10⁶ cells per lung of mice treated as in (A) determined by FACS analyses (gating strategy see Figure S15 ) of lung homogenates. (C-F), shown are the percentages of GATA-3+, Foxp3+, T-bet+ and ROR-γt+ of CD3+CD4+ T cells in the lung of mice sensitized by i.t. administration of MPE or placebo (PBS) in the presence or absence of i.t. applied BX-795 as determined by FACS analyses. (G), shown are representative lung sections stained with hematoxylin eosin (HE, upper panel) or periodic acid-Schiff (PAS, lower panel) of mice of the indicated treatment groups. (B-F), data show the mean ± SEM of pooled result from two independently performed experiments containing 8-10 mice in total per group. The indicated p-values were calculated using one-way ANOVA followed by Dunnett’s test comparing MPE stimulated BX-795 treated to counterparts. Only statistically significant changes are indicated with *, p < 0.05; **, p < 0.01.
Figure 7
Figure 7
BX-795 reduces MPE induced IL-2/IL-4 and IL-2/IL-13 co-producing T cells but not overall IL-2 producers in a murine model of mugwort allergy. Lung cells derived from mice challenged as shown in Figure 6A were stimulated for 4 h in the presence of PMA/ionomycin and protein transport inhibitors monensin/brefeldin A and then stained for CD3, CD4 and the indicated cytokines. (A), shown is the gating strategy for the analysis of IL-2/cytokine double positive cells and representative FACS plots showing co-production of indicated cytokines with IL-2 for mice treated with MPE plus solvent and MPE plus BX-795. (B), shown are the percentages of cells co-producing IL-2 and the indicated second cytokine as percent of CD3+CD4+ T cells for each treatment group. (C), shown are the percentages of all cells of CD3+CD4+ T cells producing the indicated cytokine. The total percentage of the respective cytokine producing cells was calculated from the IL-2/cytokine gates shown in (A). The percentage of all IL-2 producing cells of CD3+CD4+ T cells was calculated from the IL-2/IL-4 plots. (D), shown are the ratios of IL-2+/Cytokine- cells relative to IL-2+/Cytokine+ cells for MPE plus solvent and MPE plus BX-795 treated mice. Cells stained for the indicated cytokines were stimulated for 4 h in the presence of PMA/ionomycin and protein transport inhibitors monensin/brefeldin A, Data show the mean ± SEM of pooled results from two independently performed experiments containing n = 8 both PBS groups, MPE plus BX-795 and n = 9 MPE plus DMSO (B-D). The indicated p-values were calculated using one-way ANOVA followed by Dunnett’s test (B, C) or by an unpaired two-sided Student’s t-test (D). All comparisons performed against MPE plus solvent treated. Only statistically significant changes are indicated with *, p < 0.05; **, p < 0.01.

Similar articles

Cited by

References

    1. Mier JW, Gallo RC. Purification and some characteristics of human T-cell growth factor from phytohemagglutinin-stimulated lymphocyte-conditioned media. Proc Natl Acad Sci U.S.A. (1980) 77:6134–8. doi: 10.1073/pnas.77.10.6134 - DOI - PMC - PubMed
    1. Zorn E, Nelson EA, Mohseni M, Porcheray F, Kim H, Litsa D, et al. . IL-2 regulates FOXP3 expression in human CD4+CD25+ regulatory T cells through a STAT-dependent mechanism and induces the expansion of these cells in vivo. Blood (2006) 108:1571–9. doi: 10.1182/blood-2006-02-004747 - DOI - PMC - PubMed
    1. Fontenot JD, Rasmussen JP, Gavin MA, Rudensky AY. A function for interleukin 2 in Foxp3-expressing regulatory T cells. Nat Immunol (2005) 6:1142–51. doi: 10.1038/ni1263 - DOI - PubMed
    1. Furtado GC, Curotto de Lafaille MA, Kutchukhidze N, Lafaille JJ. Interleukin 2 signaling is required for CD4(+) regulatory T cell function. J Exp Med (2002) 196:851–7. doi: 10.1084/jem.20020190 - DOI - PMC - PubMed
    1. Malek TR, Yu A, Vincek V, Scibelli P, Kong L. CD4 regulatory T cells prevent lethal autoimmunity in IL-2Rbeta-deficient mice. Implications for the nonredundant function of IL-2. Immunity (2002) 17:167–78. doi: 10.1016/S1074-7613(02)00367-9 - DOI - PubMed

Publication types