Dynamic stability during level walking and obstacle crossing in children aged 2-5 years estimated by marker-less motion capture
- PMID: 37090815
- PMCID: PMC10116057
- DOI: 10.3389/fspor.2023.1109581
Dynamic stability during level walking and obstacle crossing in children aged 2-5 years estimated by marker-less motion capture
Abstract
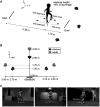
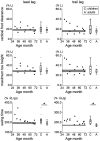
In the present study, dynamic stability during level walking and obstacle crossing in typically developing children aged 2-5 years (n = 13) and healthy young adults (n = 19) was investigated. The participants were asked to walk along unobstructed and obstructed walkways. The height of the obstacle was set at 10% of the leg length. Gait motion was captured by three RGB cameras. 2D body landmarks were estimated using OpenPose, a marker-less motion capture algorithm, and converted to 3D using direct linear transformation (DLT). Dynamic stability was evaluated using the margin of stability (MoS) in the forward and lateral directions. All the participants successfully crossed the obstacles. Younger children crossed the obstacle more carefully to avoid falls, as evidenced by obviously decreased gait speed just before the obstacle in 2-year-olds and the increased in maximum toe height with younger age. There was no significant difference in the MoS at the instant of heel contact between children and adults during level walking and obstacle crossing in the forward direction, although children increased the step length of the lead leg to a greater extent than the adults to ensure base of support (BoS)-center of mass (CoM) distance. In the lateral direction, children exhibited a greater MoS than adults during level walking [children: 9.5%, adults: 6.5%, median, W = 39.000, p < .001, rank-biserial correlation = -0.684]; however, some children exhibited a smaller MoS during obstacle crossing [lead leg: -5.9% to 3.6% (min-max) for 4 children, 4.7%-6.4% [95% confidence interval (CI)] for adults, p < 0.05; trail leg: 0.1%-4.4% (min-max) for 4 children, 4.7%-6.4% (95% CI) for adults, p < 0.05]]. These results indicate that in early childhood, locomotor adjustment needed to avoid contact with obstacles can be observed, whereas lateral dynamic stability is frangible.
Keywords: adaptive locomotion; balance; development; margin of stability (MOS); obstacle advoidance; preschoolers.
© 2023 Yoshimoto, Mani, Hirose, Kurogi, Aiko and Shinya.
Conflict of interest statement
The authors declare that the research was conducted in the absence of any commercial or financial relationships that could be construed as a potential conflict of interest.
Figures


Similar articles
-
Changes to margins of stability from walking to obstacle crossing in older adults while walking fast and with a dual-task.Exp Gerontol. 2022 May;161:111710. doi: 10.1016/j.exger.2022.111710. Epub 2022 Jan 26. Exp Gerontol. 2022. PMID: 35090973 Free PMC article.
-
How do features of dynamic postural stability change with age during quiet standing, gait, and obstacle crossing?Hum Mov Sci. 2024 Jun;95:103197. doi: 10.1016/j.humov.2024.103197. Epub 2024 Mar 10. Hum Mov Sci. 2024. PMID: 38461746
-
Effects of temporal constraints on medio-lateral stability when negotiating obstacles.Gait Posture. 2015 Jul;42(2):158-64. doi: 10.1016/j.gaitpost.2015.05.004. Epub 2015 May 18. Gait Posture. 2015. PMID: 26028527
-
Children use different anticipatory control strategies than adults to circumvent an obstacle in the travel path.Exp Brain Res. 2005 Nov;167(1):119-27. doi: 10.1007/s00221-005-0054-6. Epub 2005 Oct 29. Exp Brain Res. 2005. PMID: 16177831
-
Effects of simulated trunk flexion contracture on the margin of stability during obstacle crossing in elderly individuals.Gait Posture. 2023 May;102:139-145. doi: 10.1016/j.gaitpost.2023.03.018. Epub 2023 Mar 30. Gait Posture. 2023. PMID: 37018888
Cited by
-
Reliability of Obstacle-Crossing Parameters during Overground Walking in Young Adults.Sensors (Basel). 2024 May 24;24(11):3387. doi: 10.3390/s24113387. Sensors (Basel). 2024. PMID: 38894176 Free PMC article.
-
Age-related differences in the effect of mental fatigue on obstacle crossing in virtual reality.Sci Rep. 2025 Mar 19;15(1):9527. doi: 10.1038/s41598-025-94038-6. Sci Rep. 2025. PMID: 40108372 Free PMC article.
References
LinkOut - more resources
Full Text Sources

