

Tubomanometry in measurement of velopharyngeal closure: A pilot study
- PMID: 37090858
- PMCID: PMC10116987
- DOI: 10.1002/lio2.1039
Tubomanometry in measurement of velopharyngeal closure: A pilot study
Abstract
Objective: To investigate the differences in velum closure pattern in people with and without a history of middle ear disease using intranasal pressure curves recorded with the tubomanometer, a Eustachian tube (ET) testing device.
Study design: Case control study.
Setting: Tertiary referral center.
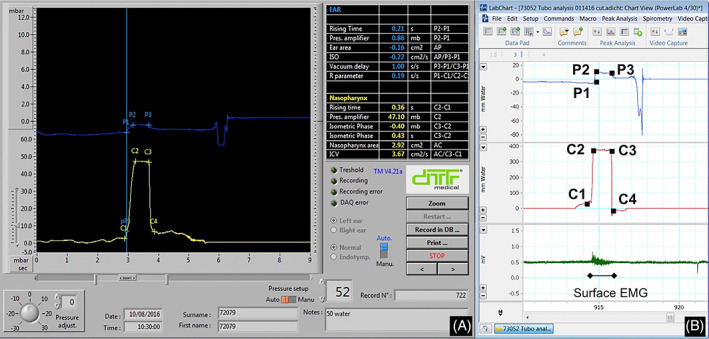
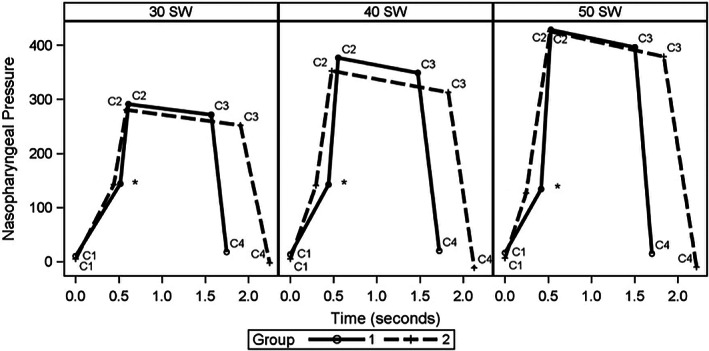
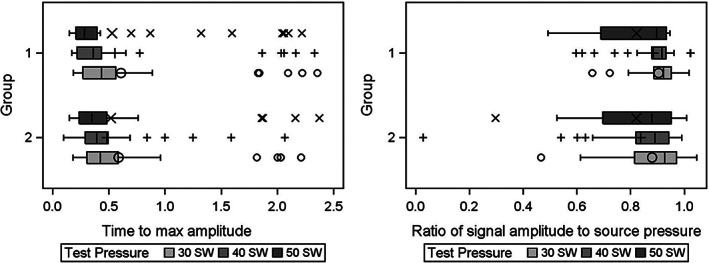
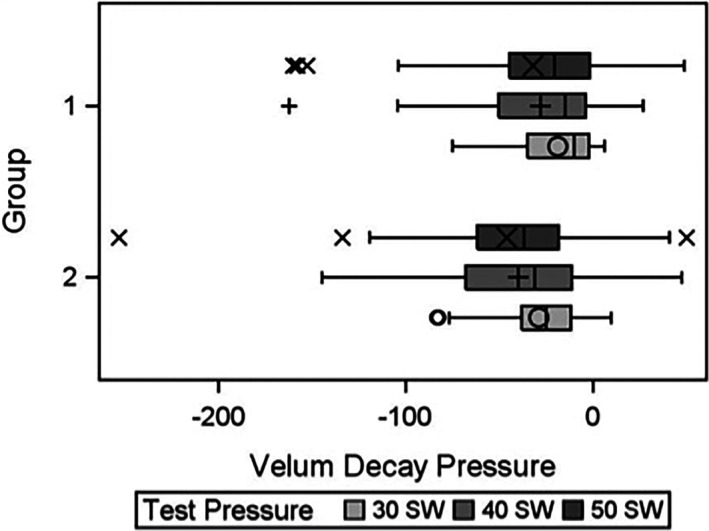
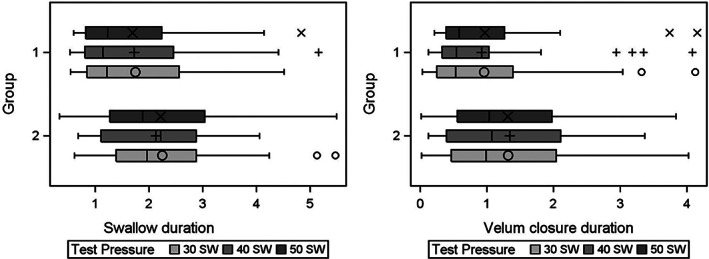
Subjects and methods: Tubomanometry nasopharyngeal pressure curves from 20 controls (Group 1) and 20 people with history of otitis media (OM) and possible ongoing ET dysfunction (ETD) (Group 2 or OM/ETD group) were compared. The variables included in the analysis were: (a) ratio of signal amplitude relative to the delivered nasal pressure (C2/delivered pressure x 10); (b) time (s) to achieve maximal signal amplitude (C2-C1); (c) duration of velum closure (s) and (d) plateau decay during the isometric contraction of the velum (C3-C2) and (e) swallow duration (s) (C4-C1). Statistical analysis was conducted using mixed models for the normalized values of individual characteristics.
Results: Age, race and sex distribution in each group was as follows: 24 ± 8 years, 15 whites and 12 females in Group 1; 20 ± 10 years, 19 whites and 15 females in Group 2. Group 2 demonstrated a greater velopharyngeal pressure decay (p = .13), longer swallow duration (p = .10), and longer duration of velum closure (p = .14).
Conclusion: This is the first study using tubomanometry to investigate differences in velopharyngeal closure between controls and individuals with OM/ETD. Although not statistically significant, our results showed that those with OM/ETD demonstrated a longer swallow and velum closure duration, and a higher degree of leakage during velum contraction compared to controls.
Keywords: Eustachian tube; otitis media; tubomanometry; velopharyngeal closure; velopharynx.
© 2023 The Authors. Laryngoscope Investigative Otolaryngology published by Wiley Periodicals LLC on behalf of The Triological Society.
Conflict of interest statement
The authors declare no conflict of interest.
Figures
Similar articles
-
Eustachian Tube Dysfunction in Children with Adenoid Hypertrophy: The Effect of Intranasal Azelastine-Fluticasone Spray Treatment on Middle Ear Ventilation and Adenoid Tissue.Ear Nose Throat J. 2023 Mar;102(3):198-203. doi: 10.1177/01455613221140281. Epub 2022 Nov 23. Ear Nose Throat J. 2023. PMID: 36416201
-
Tubomanometry correlations with patient characteristics and other diagnostic tests of Eustachian tube dysfunction: a cohort study of 432 ears.Eur Arch Otorhinolaryngol. 2022 Nov;279(11):5153-5160. doi: 10.1007/s00405-022-07358-y. Epub 2022 Apr 6. Eur Arch Otorhinolaryngol. 2022. PMID: 35381864 Free PMC article.
-
Tuboimpedance: A New Test of Eustachian Tube Function.Otolaryngol Head Neck Surg. 2017 Apr;156(4):717-721. doi: 10.1177/0194599816686546. Epub 2017 Jan 24. Otolaryngol Head Neck Surg. 2017. PMID: 28116975
-
Endolymphatic hydrops mimicking obstructive Eustachian tube dysfunction: preliminary experience and literature review.Eur Arch Otorhinolaryngol. 2021 Feb;278(2):561-565. doi: 10.1007/s00405-020-06139-9. Epub 2020 Jun 24. Eur Arch Otorhinolaryngol. 2021. PMID: 32583181 Review.
-
Role of Allergy in Eustachian Tube Dysfunction.Curr Allergy Asthma Rep. 2020 Jul 9;20(10):54. doi: 10.1007/s11882-020-00951-3. Curr Allergy Asthma Rep. 2020. PMID: 32648122 Review.
Cited by
-
Assessing the usefulness of tubomanometry as a diagnostic tool in Eustachian tube dysfunction.Eur Arch Otorhinolaryngol. 2024 Oct;281(10):5135-5143. doi: 10.1007/s00405-024-08724-8. Epub 2024 May 29. Eur Arch Otorhinolaryngol. 2024. PMID: 38809266
-
Eustachian Tube Dysfunction Diagnostic Pathway-What Is the Current State of the Art and How Relevant Is Chronic Nasal Disease?J Clin Med. 2024 Jun 25;13(13):3700. doi: 10.3390/jcm13133700. J Clin Med. 2024. PMID: 38999265 Free PMC article. Review.
References
Grants and funding
LinkOut - more resources
Full Text Sources
Miscellaneous