An R Shiny App for a Chronic Lower Back Pain Study, Personalized N-of-1 Trial
- PMID: 37091071
- PMCID: PMC10121210
- DOI: 10.1162/99608f92.6c21dab7
An R Shiny App for a Chronic Lower Back Pain Study, Personalized N-of-1 Trial
Abstract
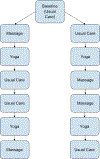
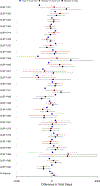
The call for personalized medicine highlights the need for personalized (N-of-1) trials to find what treatment works best for individual patients. Conventional (between-subject) randomized controlled trials (RCT) yield effects for the 'average patient,' but a personalized trial administers all treatments within-subject, so benefits or harms to the individual patient can be identified. The design and analysis of personalized trials involve different strategies from the conventional RCT. These include how to adjust for any carryover effects from one intervention to another, how to handle missing data, and how to provide patients with insight into their data. In addition, a comprehensible report about trial results should be created for each patient and their clinician to facilitate their decision-making. This article describes strategies to address these design and analytic issues, and introduces an R shiny app to facilitate their solution, to explain the use of each of the design and statistical strategies. To illustrate, we also provide a concrete example of a personalized trial series designed to increase activity (i.e., walking steps) in patients with chronic lower back pain (CLBP).
Keywords: computing platforms; fitbit data; imputation; personalized medicine.
Figures


References
-
- Alemayehu C, Mitchell G, Aseffa A, Clavarino A, McGree J, & Nikles J. (2017). A series of n-of-1 trials to assess the therapeutic interchangeability of two enalapril formulations in the treatment of hypertension in Addis Ababa, Ethiopia: Study protocol for a randomized controlled trial. Trials, 18(1), Article 470. 10.1186/s13063-017-2212-0 - DOI - PMC - PubMed
Grants and funding
LinkOut - more resources
Full Text Sources
Miscellaneous
