. 2023 Mar 21;26(4):106480.
doi: 10.1016/j.isci.2023.106480. eCollection 2023 Apr 21.

Neoadjuvant chemotherapy enhances anti-tumor immune response of tumor microenvironment in human esophageal squamous cell carcinoma

Affiliations

Neoadjuvant chemotherapy enhances anti-tumor immune response of tumor microenvironment in human esophageal squamous cell carcinoma

Sho Okuda et al. iScience. .

Abstract

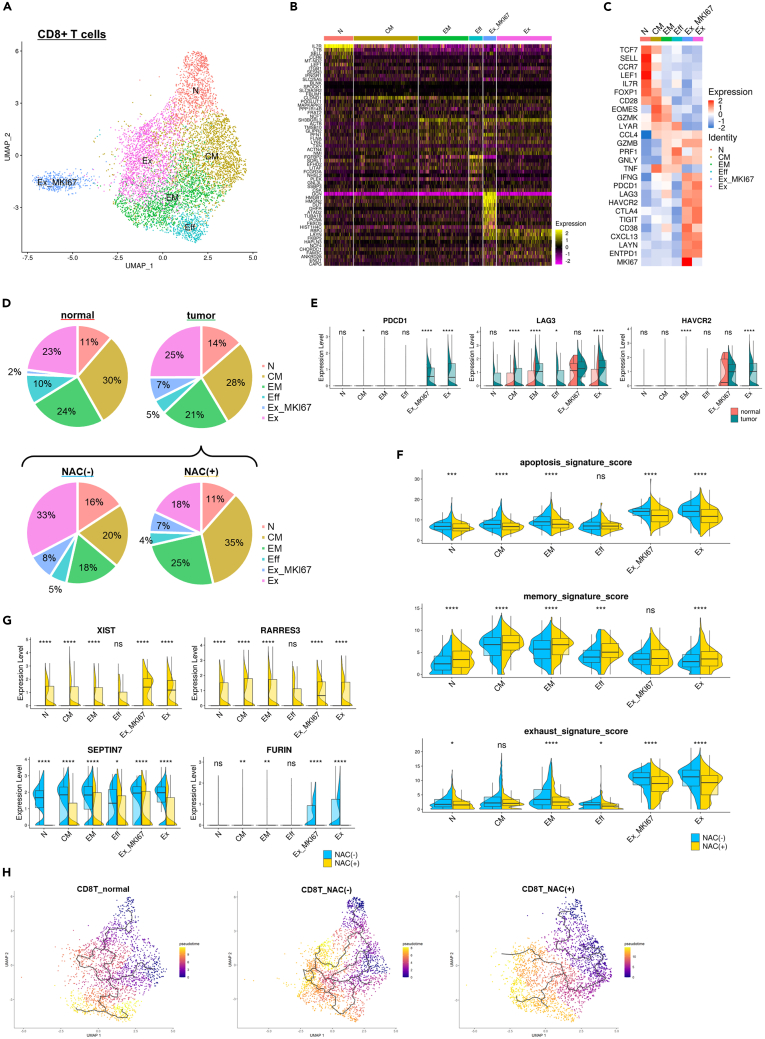
Although chemotherapy has been an essential treatment for cancer, the development of immune checkpoint blockade therapy was revolutionary, and a comprehensive understanding of the immunological tumor microenvironment (TME) has become crucial. Here, we investigated the impact of neoadjuvant chemotherapy (NAC) on immune cells in the TME of human esophageal squamous cell carcinoma using single cell RNA-sequencing. Analysis of 30 fresh samples revealed that CD8+/CD4+ T cells, dendritic cells (DCs), and macrophages in the TME of human esophageal squamous cell carcinoma showed higher levels of an anti-tumor immune response in the NAC(+) group than in the NAC(-) group. Furthermore, the immune cells of the NAC(+) group interacted with each other resulting in enhanced anti-tumor immune response via various cytokines, including IFNG in CD8+/CD4+ T cells, EBI3 in DCs, and NAMPT in macrophages. Our results suggest that NAC potentially enhances the anti-tumor immune response of immune cells in the TME.

Keywords: Cancer; Immunology; Transcriptomics.


Conflict of interest statement

The authors declare no competing interests.

Figures

None
Graphical abstract
Figure 1
Figure 1
scRNA-seq classifies CD45+ cells into clusters of known cell types (A) Experimental design and analysis. (B) UMAP plot of 83,151 CD45+ cells after quality check, normalization, and exclusion of doublets and contamination cells. The cell type was determined based on the expression of known marker genes. (C) Expression of representative marker genes in UMAP. (D) The location of the cells in each sample in the UMAP. (E) Percentage of cell types by (left) sample, and (right) normal mucosa, and tumor tissue. ESCC, esophageal squamous cell carcinoma; CD4T, CD4+ T cells; CD4T_FOXP3, CD4+ FOXP3+ T cells; CD8T, CD8+ T cells; NK, natural killer cells; B, B cells; plasma, plasma cells; DC, dendritic cells; SCC, tumor tissue; SCN, normal mucosa. See also Figure S1 and Table S1.
Figure 2
Figure 2
NAC enhances the anti-tumor immune response in each cluster of CD8T in the TME by reducing apoptosis, promoting memorization, and preventing exhaustion (A) UMAP plot of 8,005 CD8+ T cells extracted from CD45+ cells. The function of each cluster was determined based on the gene expression. (B) Heatmap used as the basis for clustering. In each cluster, the top 10 genes with significantly higher expression than in other clusters are shown. (C) Heatmap of representative gene expression in each cluster. (D) Percentage of the number of cells composing each cluster. The top charts show normal mucosa and tumor tissue, and the bottom charts are shown by the presence of NAC in the tumor tissue. (E) Comparison of exhaust gene expression in normal mucosa and tumor tissue. The violin plots were drawn based on the number of genes expressed in each cell. (F) Comparison of signature gene expression in tumor tissue with and without NAC. The violin plots were drawn based on the scored signature gene expression in each cell. (G) Comparison of XIST, RARRES3, SEPTIN7, and FURIN gene expression in tumor tissue with and without NAC. The violin plots were drawn on the basis of the number of genes expressed in each cell. (H) Trajectory analysis of normal mucosa, tumor tissue without NAC, and tumor tissue with NAC. The pseudotime trajectory was calculated with darker colors indicating older and lighter colors indicating newer. CD8T, CD8+ T cell; N, naive CD8T; CM, central memory CD8T; EM, effector memory CD8T; Eff, effector CD8T; Ex_MKI67, proliferative exhausted CD8T; Ex, exhausted CD8T; normal, normal mucosa; tumor, tumor tissue; NAC, neoadjuvant chemotherapy; ns, not significant; ∗, p < 0.05; ∗∗, p < 0.01; ∗∗∗, p < 0.001; ∗∗∗∗, p < 0.0001. See also Figures S2, S3, Tables S2, and S3.
Figure 3
Figure 3
NAC promotes the anti-tumor immune response in each cluster of CD4T (A) UMAP plot of 6,453 CD4+ T cells extracted from CD45+ cells. The function of each cluster was determined based on the gene expression. (B) Heatmap used as the basis for clustering. In each cluster, the top 10 genes with significantly higher expression than the expressions in the other clusters are shown. (C) Heatmap of representative gene expression in each cluster. (D) Percentage of the number of cells composing each cluster. The top graphs show normal mucosa and tumor tissue, and the bottom graphs are shown by the presence of NAC in the tumor tissue. (E) Comparison of various gene expression in normal mucosa and tumor tissue. The violin plots were drawn based on the number of genes expressed in each cell. (F and G) Comparison of signature gene expression in tumor tissue with and without NAC. The violin plots were drawn based on the scored signature gene expression in each cell. CD4T, CD4+ T cell; N, naive CD4T; Tfh, follicular helper CD4T; Th1, type 1 helper CD4T; Ex, exhausted CD4T; Treg_MKI67, proliferative regulatory CD4T; Treg, regulatory CD4T; normal, normal mucosa; tumor, tumor tissue; NAC, neoadjuvant chemotherapy; ns, not significant; ∗, p < 0.05; ∗∗, p < 0.01; ∗∗∗, p < 0.001; ∗∗∗∗, p < 0.0001. See also Figures S4, S5, Tables S2, and S3.
Figure 4
Figure 4
NAC enhanced the anti-tumor immune response of each DC cluster in the TME (A) UMAP plot of 740 DCs extracted from myeloid cells. The cell types of each cluster were determined based on the gene expression. (B) Heatmap of representative gene expression. (C) Expression of representative marker genes in UMAP. (D) Percentage of the number of cells composing each cluster. The top graphs show normal mucosa and tumor tissue, and the bottom graphs are shown by the presence of NAC in the tumor tissue. (E) Comparison of signature gene expression in tumor tissue with and without NAC. The violin plots were drawn based on the scored signature gene expression in each cell. (F) Comparison of IDO1 and CD274 gene expression in tumor tissue with and without NAC. The size of the dots indicates the percentage of expressing cells in the cluster, and the brightness of the dots indicates the expression level of the cluster. DC, dendritic cell; MKI67, MKI67 rich cell; HSP, heat shock protein cell; cDC1, conventional DC type1; cDC2, conventional DC type2; moDC, monocyte-derived DC; DC_CCR7, CCR7 rich DC; normal, normal mucosa; tumor, tumor tissue; NAC, neoadjuvant chemotherapy; ns, not significant; ∗, p < 0.05; ∗∗, p < 0.01; ∗∗∗, p < 0.001; ∗∗∗∗, p < 0.0001. See also Figures S6, S7, S8, Tables S2, and S3.
Figure 5
Figure 5
NAC enhances anti-tumor activity in each cluster of Mφ via the increased chemotaxis and the decreased suppressive function (A) UMAP plot of 5,756 macrophages extracted from myeloid cells. The cells were divided into four clusters. (B) Expression of representative marker genes for M1 and M2 in UMAP. (C) Trajectory analysis of macrophages. The pseudotime trajectory was calculated with darker colors indicating older and lighter colors indicating newer. (D) Heatmap of representative gene expression. From this gene expression pattern, the function of each cluster was determined as shown in the figure. (E) Percentage of the number of cells composing each cluster. The top graphs show normal mucosa and tumor tissue, and the bottom graphs are shown as the presence of NAC in the tumor tissue. (F) Comparison of signature gene expression in tumor tissue with and without NAC. The violin plots were drawn on the basis of the scored signature gene expression in each cell. M, macrophage; normal, normal mucosa; tumor, tumor tissue; NAC, neoadjuvant chemotherapy; ns, not significant; ∗, p < 0.05; ∗∗, p < 0.01; ∗∗∗, p < 0.001; ∗∗∗∗, p < 0.0001. See also Figures S9, S10, Tables S2, and S3.
Figure 6
Figure 6
NAC promotes the interactions among immune cell clusters in the TME to enhance their anti-tumor immune responses (A–E) Interactions between clusters evaluated up to Figure 5. The lower half of the circle shows the ligand genes labeled as “LIGAND.” The ligand genes identified in multiple clusters are shown as “General cells.” The upper half of the circle shows the genes that were eventually produced by the receptors that responded to the identified ligands; these genes are labeled as “TARGET.” The receiver clusters for analysis were specified as (A) Treg, (B) cDC2, (C) DC_CCR7, (D) M_chemotaxis, and (E) M_mature. Each violin plot compares gene expression in the cells that can influence tumor progression in the receiver cluster of tumor tissue with and without NAC. (F) Cluster-wise comparison of the expression of genes identified as “LIGAND” that could influence the “TARGET.”. CD8T, CD8+ T cell; Eff, effector CD8T; CD4T, CD4+ T cell; N, naive CD4T; Tfh, follicular helper CD4T; Th1, type 1 helper CD4T; Treg, regulatory CD4T; Ex, exhausted cell; DC, dendritic cell; cDC2, conventional DC type2; DC_CCR7, CCR7 rich DC; M, macrophage; normal, normal mucosa; tumor, tumor tissue; NAC, neoadjuvant chemotherapy; ns, not significant; ∗, p < 0.05; ∗∗, p < 0.01; ∗∗∗, p < 0.001; ∗∗∗∗, p < 0.0001.

References

    1. Bray F., Ferlay J., Soerjomataram I., Siegel R.L., Torre L.A., Jemal A. Global cancer statistics 2018: GLOBOCAN estimates of incidence and mortality worldwide for 36 cancers in 185 countries. CA. Cancer J. Clin. 2018;68:394–424. doi: 10.3322/caac.21492. - DOI - PubMed
    1. Watanabe M., Tachimori Y., Oyama T., Toh Y., Matsubara H., Ueno M., Kono K., Uno T., Ishihara R., Muro K., et al. Comprehensive registry of esophageal cancer in Japan, 2014. Esophagus. 2021;18:1–24. doi: 10.1007/s10388-020-00785-y. - DOI - PMC - PubMed
    1. Kamarajah S.K., Navidi M., Wahed S., Immanuel A., Hayes N., Griffin S.M., Phillips A.W. Significance of neoadjuvant downstaging in carcinoma of esophagus and gastroesophageal junction. Ann. Surg Oncol. 2020;27:3182–3192. doi: 10.1245/s10434-020-08358-0. - DOI - PMC - PubMed
    1. Hiraki Y., Kimura Y., Imano M., Kato H., Iwama M., Shiraishi O., Yasuda A., Shinkai M., Makino T., Motoori M., et al. Controlling lymph node micrometastases by neoadjuvant chemotherapy affects the prognosis in advanced esophageal squamous cell carcinoma. Surg. Today. 2021;51:118–126. doi: 10.1007/s00595-020-02059-7. - DOI - PubMed
    1. Ando N., Kato H., Igaki H., Shinoda M., Ozawa S., Shimizu H., Nakamura T., Yabusaki H., Aoyama N., Kurita A., et al. A randomized trial comparing postoperative adjuvant chemotherapy with cisplatin and 5-fluorouracil versus preoperative chemotherapy for localized advanced squamous cell carcinoma of the thoracic esophagus (JCOG9907) Ann. Surg Oncol. 2012;19:68–74. doi: 10.1245/s10434-011-2049-9. - DOI - PubMed