

Structure-affinity and structure-residence time relationships of macrocyclic Gαq protein inhibitors
- PMID: 37091255
- PMCID: PMC10119753
- DOI: 10.1016/j.isci.2023.106492
Structure-affinity and structure-residence time relationships of macrocyclic Gαq protein inhibitors
Abstract
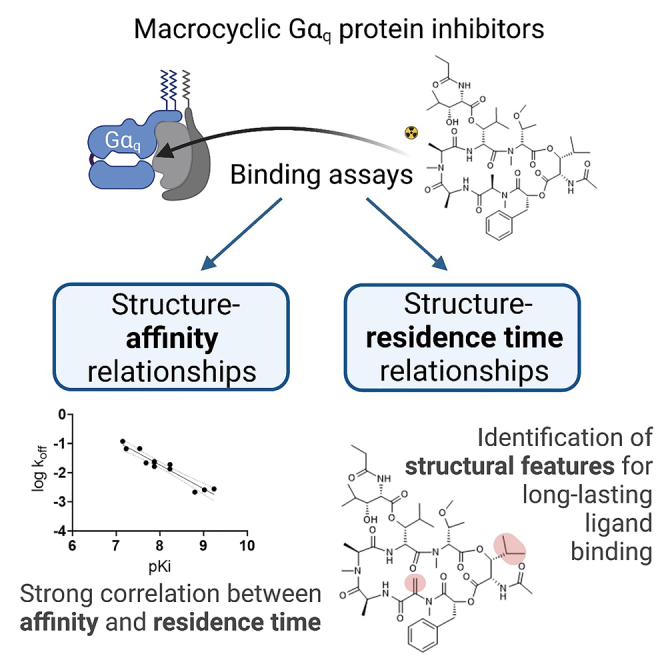
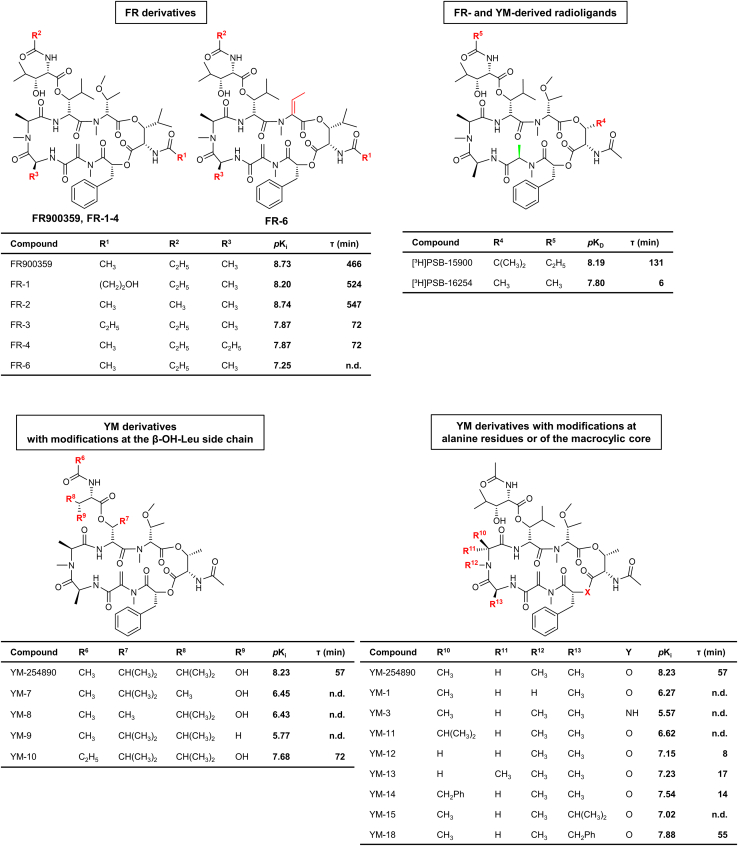
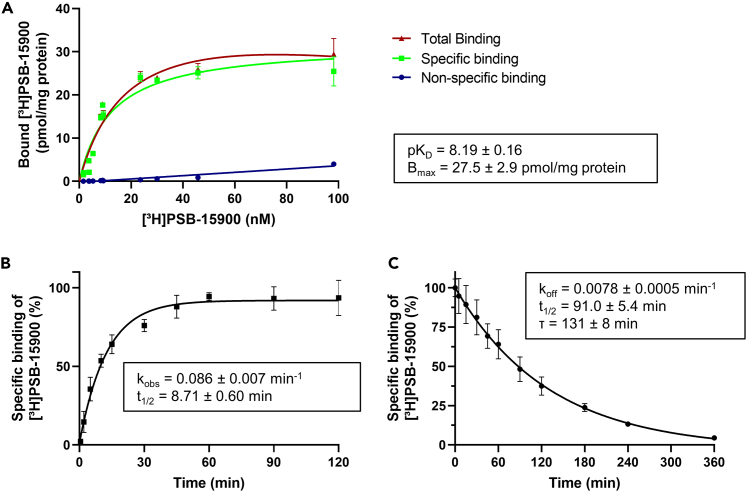
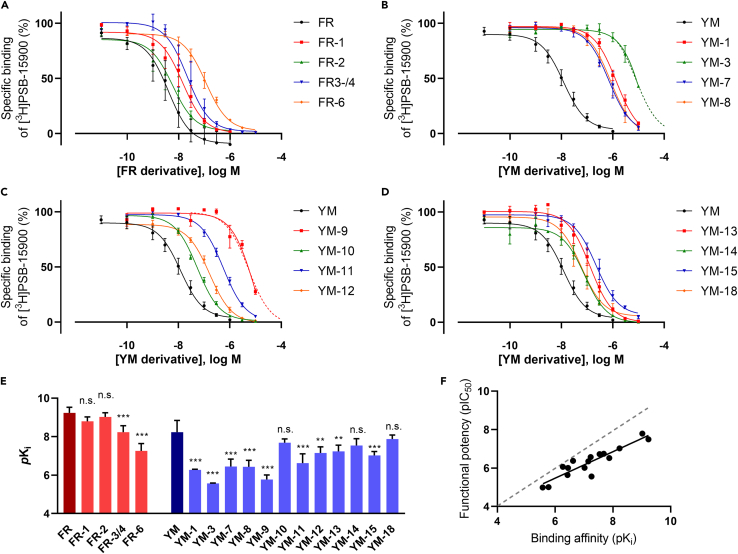
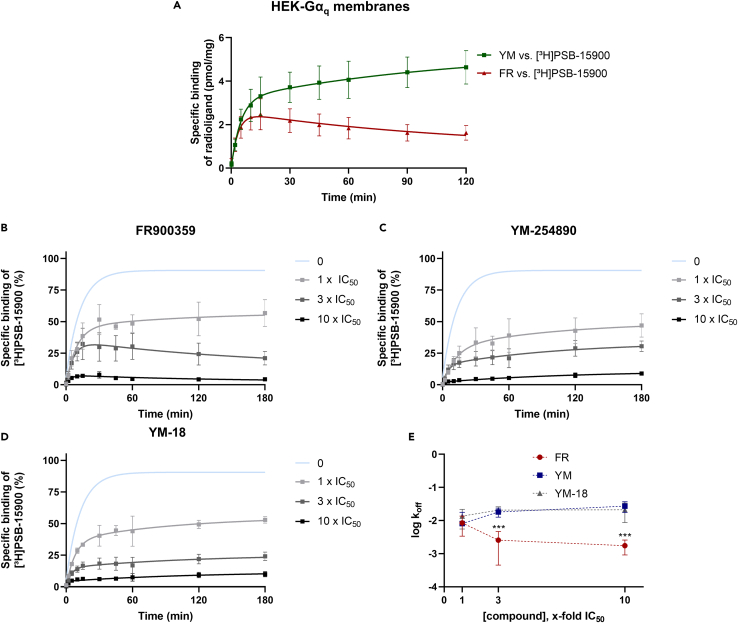
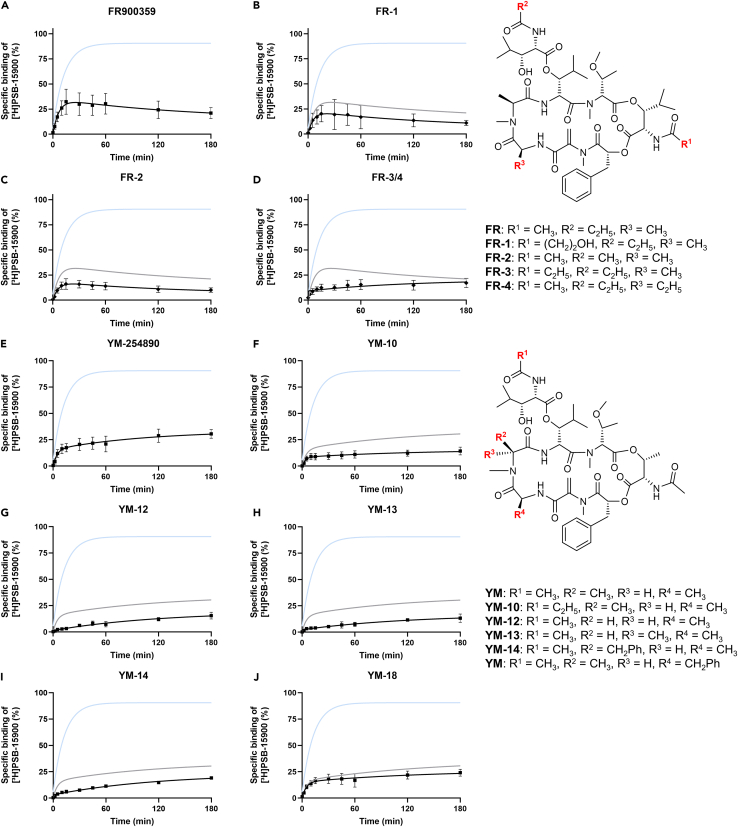
The macrocyclic depsipeptides YM-254890 (YM) and FR900359 (FR) are potent inhibitors of Gαq/11 proteins. They are important pharmacological tools and have potential as therapeutic drugs. The hydrogenated, tritium-labeled YM and FR derivatives display largely different residence times despite similar structures. In the present study we established a competition-association binding assay to determine the dissociation kinetics of unlabeled Gq protein inhibitors. Structure-affinity and structure-residence time relationships were analyzed. Small structural modifications had a large impact on residence time. YM and FR exhibited 4- to 10-fold higher residence times than their hydrogenated derivatives. While FR showed pseudo-irreversible binding, YM displayed much faster dissociation from its target. The isopropyl anchor present in FR and some derivatives was essential for slow dissociation. These data provide a basis for future drug design toward modulating residence times of macrocyclic Gq protein inhibitors, which has been recognized as a crucial determinant for therapeutic outcome.
Keywords: Biochemistry; Biological sciences; Pharmacology.
© 2023 The Authors.
Conflict of interest statement
The authors declare no competing interests.
Figures
Similar articles
-
Recommended Tool Compounds: Application of YM-254890 and FR900359 to Interrogate Gαq/11-Mediated Signaling Pathways.ACS Pharmacol Transl Sci. 2023 Nov 10;6(12):1790-1800. doi: 10.1021/acsptsci.3c00214. eCollection 2023 Dec 8. ACS Pharmacol Transl Sci. 2023. PMID: 38093837 Free PMC article. Review.
-
Unraveling binding mechanism and kinetics of macrocyclic Gαq protein inhibitors.Pharmacol Res. 2021 Nov;173:105880. doi: 10.1016/j.phrs.2021.105880. Epub 2021 Sep 17. Pharmacol Res. 2021. PMID: 34506902
-
Macrocyclic Gq Protein Inhibitors FR900359 and/or YM-254890-Fit for Translation?ACS Pharmacol Transl Sci. 2021 Feb 19;4(2):888-897. doi: 10.1021/acsptsci.1c00021. eCollection 2021 Apr 9. ACS Pharmacol Transl Sci. 2021. PMID: 33860209 Free PMC article.
-
Cell-permeable high-affinity tracers for Gq proteins provide structural insights, reveal distinct binding kinetics and identify small molecule inhibitors.Br J Pharmacol. 2020 Apr;177(8):1898-1916. doi: 10.1111/bph.14960. Epub 2020 Feb 11. Br J Pharmacol. 2020. PMID: 31881095 Free PMC article.
-
The chromodepsins - chemistry, biology and biosynthesis of a selective Gq inhibitor natural product family.Nat Prod Rep. 2021 Dec 15;38(12):2276-2292. doi: 10.1039/d1np00005e. Nat Prod Rep. 2021. PMID: 33998635 Review.
Cited by
-
Cyclic peptide inhibitors function as molecular glues to stabilize Gq/11 heterotrimers.Proc Natl Acad Sci U S A. 2025 May 13;122(19):e2418398122. doi: 10.1073/pnas.2418398122. Epub 2025 May 7. Proc Natl Acad Sci U S A. 2025. PMID: 40333756 Free PMC article.
-
Structural response of G protein binding to the cyclodepsipeptide inhibitor FR900359 probed by NMR spectroscopy.Chem Sci. 2024 Jul 4;15(32):12939-12956. doi: 10.1039/d4sc01950d. eCollection 2024 Aug 14. Chem Sci. 2024. PMID: 39148790 Free PMC article.
-
Rational Design of Ligands with Optimized Residence Time.ACS Pharmacol Transl Sci. 2025 Jan 14;8(2):613-615. doi: 10.1021/acsptsci.4c00740. eCollection 2025 Feb 14. ACS Pharmacol Transl Sci. 2025. PMID: 39974642
-
Recommended Tool Compounds: Application of YM-254890 and FR900359 to Interrogate Gαq/11-Mediated Signaling Pathways.ACS Pharmacol Transl Sci. 2023 Nov 10;6(12):1790-1800. doi: 10.1021/acsptsci.3c00214. eCollection 2023 Dec 8. ACS Pharmacol Transl Sci. 2023. PMID: 38093837 Free PMC article. Review.
-
Symmetric Ligand Binding Pathways and Dual-State Bottleneck in [NiFe] Hydrogenases from Unbiased Molecular Dynamics.J Phys Chem Lett. 2025 Aug 7;16(31):7960-7967. doi: 10.1021/acs.jpclett.5c01673. Epub 2025 Jul 29. J Phys Chem Lett. 2025. PMID: 40729627 Free PMC article.
References
LinkOut - more resources
Full Text Sources
