. 2023 Apr 20;13(4):e9923.
doi: 10.1002/ece3.9923. eCollection 2023 Apr.

Lower nutritional state and foraging success in an Arctic seabird despite behaviorally flexible responses to environmental change

Affiliations

Lower nutritional state and foraging success in an Arctic seabird despite behaviorally flexible responses to environmental change

Alyssa Eby et al. Ecol Evol. .

Abstract

The degree to which individuals adjust foraging behavior in response to environmental variability can impact foraging success, leading to downstream impacts on fitness and population dynamics. We examined the foraging flexibility, average daily energy expenditure, and foraging success of an ice-associated Arctic seabird, the thick-billed murre (Uria lomvia) in response to broad-scale environmental conditions at two different-sized, low Arctic colonies located <300 km apart. First, we compared foraging behavior (measured via GPS units), average daily energy expenditure (estimated from GPS derived activity budgets), and foraging success (nutritional state measured via nutritional biomarkers pre- and post- GPS deployment) of murres at two colonies, which differ greatly in size: 30,000 pairs breed on Coats Island, Nunavut, and 400,000 pairs breed on Digges Island, Nunavut. Second, we tested whether colony size within the same marine ecosystem altered foraging behavior in response to broad-scale environmental variability. Third, we tested whether environmentally induced foraging flexibility influenced the foraging success of murres. Murres at the larger colony foraged farther and longer but made fewer trips, resulting in a lower nutritional state and lower foraging success compared to birds at the smaller colony. Foraging behavior and foraging success varied in response to environmental variation, with murres at both colonies making longer, more distant foraging trips in high ice regimes during incubation, suggesting flexibility in responding to environmental variability. However, only birds at the larger colony showed this same flexibility during chick rearing. Foraging success at both colonies was higher during high ice regimes, suggesting greater prey availability. Overall, murres from the larger colony exhibited lower foraging success, and their foraging behavior showed stronger responses to changes in broad-scale conditions such as sea ice regime. Taken together, this suggests that larger Arctic seabird colonies have higher behavioral and demographic sensitivity to environmental change.

Keywords: Arctic; climate change; daily energy expenditure; foraging flexibility; foraging success: nutritional biomarkers; sea ice; thick‐billed murre.


Figures

FIGURE 1
FIGURE 1
Sea ice concentration (%) throughout the thick‐billed murre breeding period (15 June to 15 August) at Coats Island, Nunavut (top left panel), circles depict mean lay dates and triangles depict mean hatch dates respective to study years, straight horizontal lines indicate the incubation GPS deployment range for each study year. Low ice regime years (low sea ice concentration, high sea surface temperarture) are shown in red and light red (2017 and 2019) and high ice regime years (high sea ice concentration, low sea surface temperature) are shown in blue (2018). Maps show sea ice concentration (SIC; %) on the first day of GPS deployments in 2017 (ordinal day of year 184; July 3rd; top right panel), 2018 (ordinal day of year 187; July 6th; bottom left panel), and 2019 (ordinal day of year 182; July 1st; bottom right panel), black circle indicates the maximum foraging range (130 km) of thick‐billed murres at Coats Island (turquoise star).
FIGURE 2
FIGURE 2
Sea surface temperature (°C) throughout the thick‐billed murre breeding period (15 June to 15 August) at Coats Island, Nunavut (left panel) and Digges Island, Nunavut (right panel), circles depict mean lay dates and triangles depict mean hatch dates respective to study years, straight horizontal lines indicate the chick‐rearing GPS deployment range for each study year. Low ice regime years (low sea ice concentration, high sea surface temperarture) are shown in red and light red (2014, 2016, 2017, and 2019), and high ice regime years (high sea ice concentration, low sea surface temperature) are shown in blue (2015 and 2018).
FIGURE 3
FIGURE 3
Sea ice concentration (%) throughout the thick‐billed murre breeding period (15 June to 15 August) at Digges Island, Nunavut (left panel), circles depict mean lay dates and triangles depict mean hatch dates respective to study years, straight horizontal lines indicate the incubation GPS deployment range for each study year. Low ice regime years (low sea ice concentration, high sea surface temperarture) are shown in red and light red (2014 and 2016) and high ice regime years (high sea ice concentration, low sea surface temperature) are shown in blue (2015). Maps show sea ice concentration (SIC; %) on the first day of GPS deployments in 2014 (ordinal day of year 198; July 17th; center panel) and 2015 (ordinal day of year 199; July 18th; right panel), and black circle indicates the maximum foraging range (300 km) of thick‐billed murres at Digges Island (orange star).
FIGURE 4
FIGURE 4
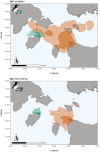
Foraging distribution of thick‐billed murres from Coats Island, Nunavut (turquoise; 2017, 2018, and 2019) and Digges Island, Nunavut (orange; 2014, 2015, and 2016) during incubation (top panel) and chick‐rearing (bottom panel) stages. Dashed lines represent the overall foraging area (95% utilization distributions), and solid lines represent the core foraging area (50% utilization distributions). Stars represent colony locations.
FIGURE 5
FIGURE 5
Intercolony variation in thick‐billed murre foraging behavior during the incubation stage (fPC1—maximum distance traveled, average daily distance, mean trip distance, mean trip duration, and number of trips per day; top panels) and chick‐rearing stage (fPC1—maximum distance traveled, mean trip distance, mean trip duration, and number of trips per day; bottom panels) at Coats Island, Nunavut (left panels; turquoise) in 2017 (dark red; low sea ice regime), 2018 (blue; high sea ice regime), and 2019 (light red; low sea ice regime), and at Digges Island, Nunavut (right panels; orange) in 2014 (dark red; low sea ice regime), 2015 (blue; high sea ice regime), amd 2016 (light red; low ice regime).

References

    1. Anteau, M. J. , & Afton, A. D. (2008). Using plasma‐lipid metabolites to index changes in lipid reserves of free‐living Lesser Scaup (Aythya affinis). The Auk, 125(2), 354–357. 10.1525/auk.2008.06255 - DOI
    1. Ashmole, N. P. (1963). The regulation of numbers of tropical oceanic birds. Ibis, 103(3), 458–473. 10.1111/j.1474-919X.1963.tb06766.x - DOI
    1. Barbraud, C. , & Weimerskirch, H. (2003). Climate and density shape population dynamics of a marine top predator. Proceedings of the Royal Society B: Biological Sciences, 270(1529), 2111–2116. 10.1098/rspb.2003.2488 - DOI - PMC - PubMed
    1. Bartoń, K. (2022). MuMIn: Multi‐model inference. R package version 1.47.1. https://CRAN.R‐project.org/package=MuMIn
    1. Bates, D. , Mächler, M. , Bolker, B. M. , & Walker, S. C. (2015). Fitting linear mixed‐effects models using lme4. Journal of Statistical Software, 67(1), 1–48. 10.18637/jss.v067.i01 - DOI

LinkOut - more resources