

Mule deer fawn recruitment dynamics in an energy disturbed landscape
- PMID: 37091564
- PMCID: PMC10116077
- DOI: 10.1002/ece3.9976
Mule deer fawn recruitment dynamics in an energy disturbed landscape
Abstract
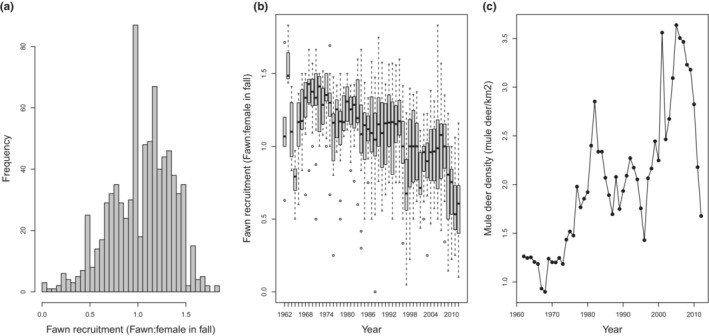
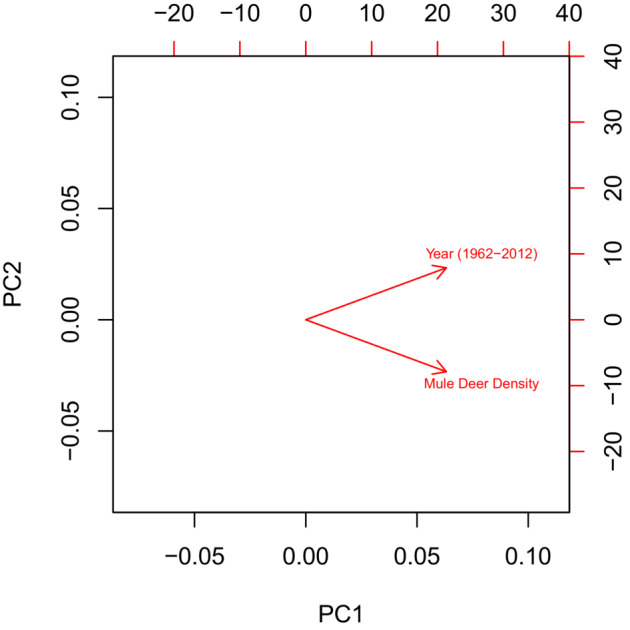
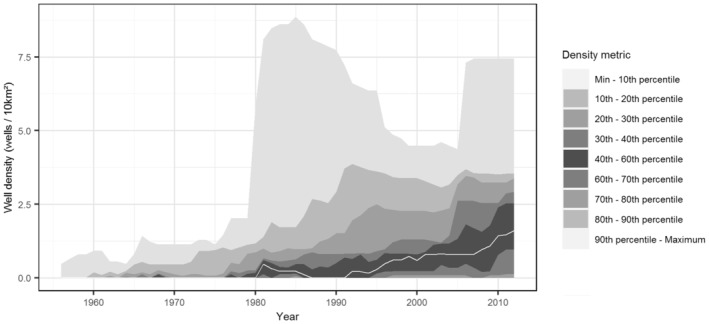
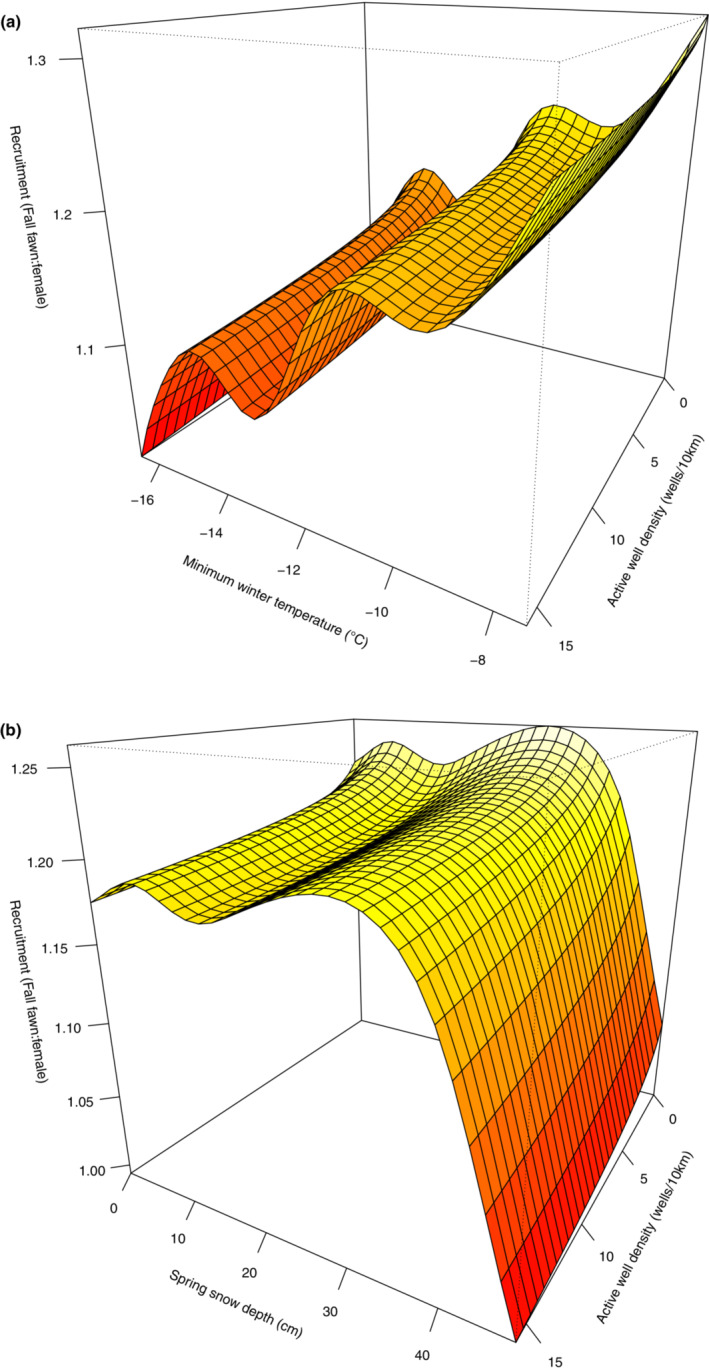
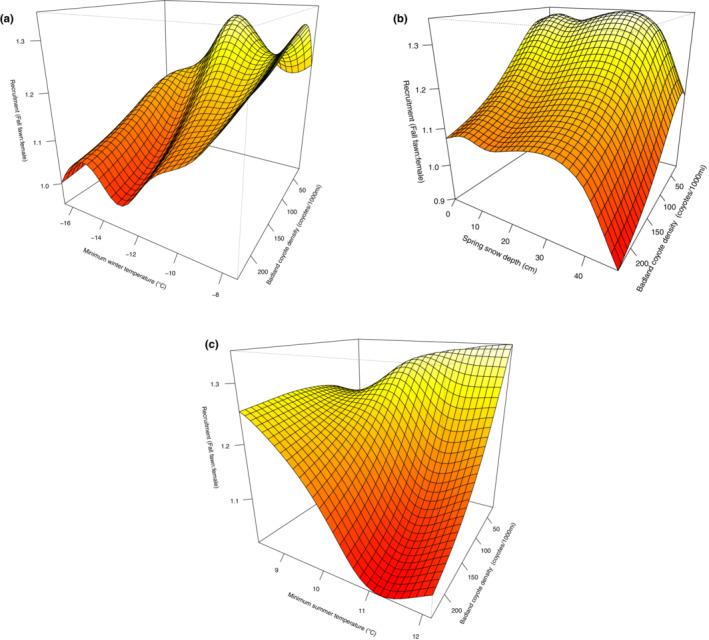
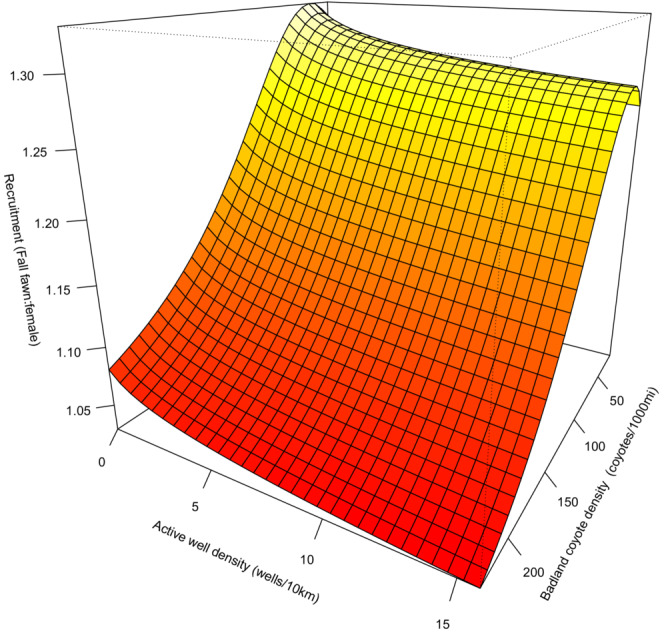
Wildlife population dynamics are modulated by abiotic and biotic factors, typically climate, resource availability, density-dependent effects, and predator-prey interactions. Understanding whether and how human-caused disturbances shape these ecological processes is helpful for the conservation and management of wildlife and their habitats within increasingly human-dominated landscapes. However, many jurisdictions lack either long-term longitudinal data on wildlife populations or measures of the interplay between human-mediated disturbance, climate, and predator density. Here, we use a 50-year time series (1962-2012) on mule deer (Odocoileus hemionus) demographics, seasonal weather, predator density, and oil and gas development patterns from the North Dakota Badlands, USA, to investigate long-term effects of landscape-level disturbance on mule deer fawn fall recruitment, which has declined precipitously over the last number of decades. Mule deer fawn fall recruitment in this study represents the number of fawns per female (fawn:female ratio) that survive through the summer to October. We used this fawn recruitment index to evaluate the composite effects of interannual extreme weather conditions, energy development, and predator density. We found that density-dependent effects and harsh seasonal weather were the main drivers of fawn fall recruitment in the North Dakota Badlands. These effects were further shaped by the interaction between harsh seasonal weather and predator density (i.e., lower fawn fall recruitment when harsh weather was combined with higher predator density). Additionally, we found that fawn fall recruitment was modulated by interactions between seasonal weather and energy development (i.e., lower fawn fall recruitment when harsh weather was combined with higher density of active oil and gas wells). Interestingly, we found that the combined effect of predator density and energy development was not interactive but rather additive. Our analysis demonstrates how energy development may modulate fluctuations in mule deer fawn fall recruitment concurrent with biotic (density-dependency, habitat, predation, woody vegetation encroachment) and abiotic (harsh seasonal weather) drivers. Density-dependent patterns emerge, presumably due to limited quality habitat, being the primary factor influencing fall fawn recruitment in mule deer. Secondarily, stochastic weather events periodically cause dramatic declines in recruitment. And finally, the additive effects of human disturbance and predation can induce fluctuations in fawn fall recruitment. Here we make the case for using long-term datasets for setting long-term wildlife management goals that decision makers and the public can understand and support.
Keywords: disturbance; energy development; game management; harsh weather; mule deer; mule deer fawn survival; predator‐prey; recruitment; wildlife management.
© 2023 The Authors. Ecology and Evolution published by John Wiley & Sons Ltd.
Conflict of interest statement
The authors have no conflict of interest to declare.
Figures


References
-
- Allen, M. C. , & Read, A. J. (2000). Habitat selection of foraging bottlenose dolphins in relation to boat density near Clearwater, Florida. Marine Mammal Science, 16, 815–824.
-
- Allred, B. , Smith, W. , Twidwell, D. , Haggerty, J. , Running, S. , Naugle, D. , & Fuhlendorf, S. (2015). Ecosystem services lost to oil and gas in North America. Science, 348(6233), 401–402. - PubMed
-
- Ballard, W. B. , Lutz, D. , Keegan, T. W. , Carpenter, L. H. , & deVos, J. C. (2001). Deer‐predator relationships: A review of recent north American studies with emphasis on mule and black‐tailed deer. Wildlife Society Bulletin, 29, 99–115.
-
- Barton, K. (2022). MuMIn: multi‐model inference . R package version 1.47.1. 0. http://r‐forge.r‐project.org/projects/mumin/
-
- Basille, M. , Fortin, D. , Dussault, C. , Ouellet, J. P. , & Courtois, R. (2013). Ecologically based definition of seasons clarifies predator–prey interactions. Ecography, 36(2), 220–229.
Associated data
LinkOut - more resources
Full Text Sources
