

Novel hypoxia-related gene signature for predicting prognoses that correlate with the tumor immune microenvironment in NSCLC
- PMID: 37091782
- PMCID: PMC10115983
- DOI: 10.3389/fgene.2023.1115308
Novel hypoxia-related gene signature for predicting prognoses that correlate with the tumor immune microenvironment in NSCLC
Abstract
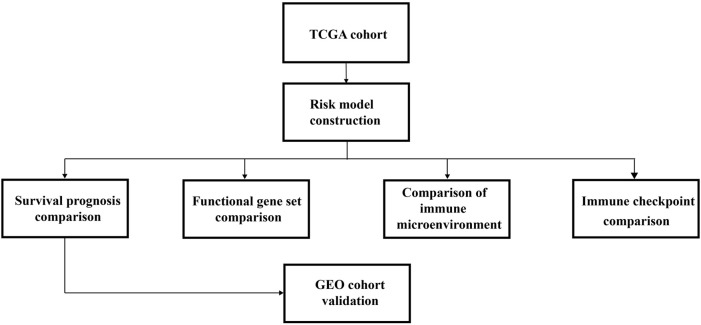
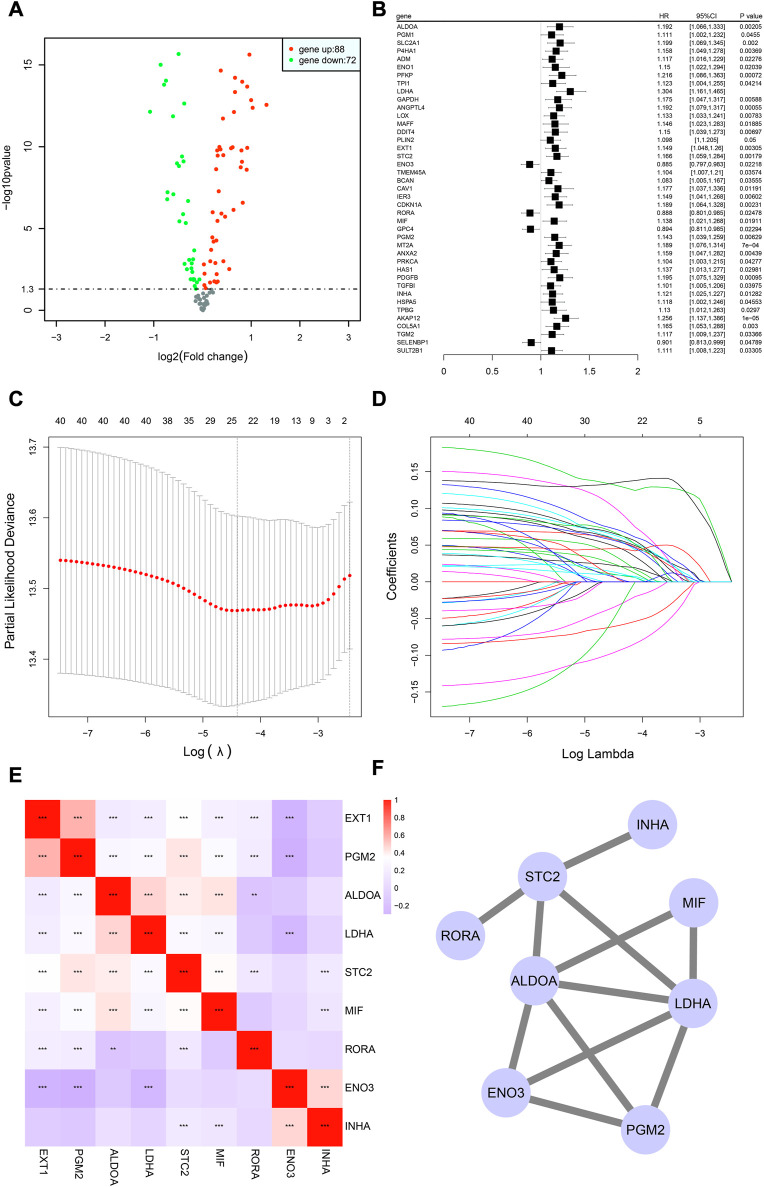
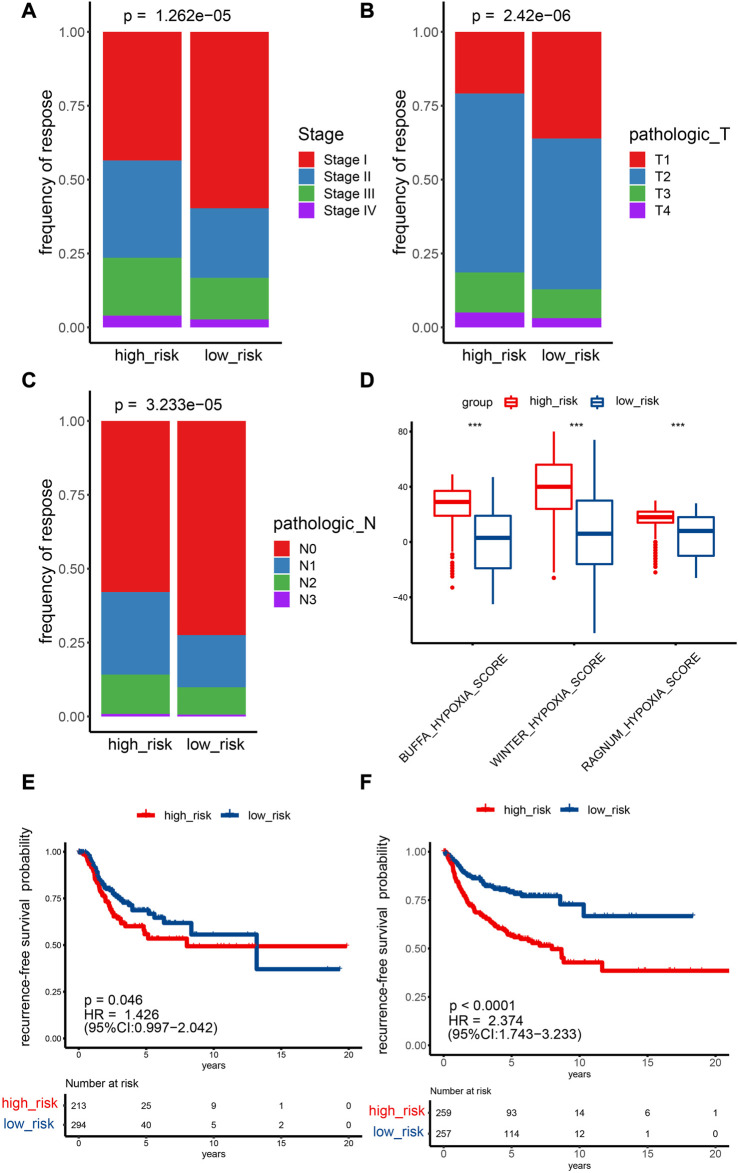
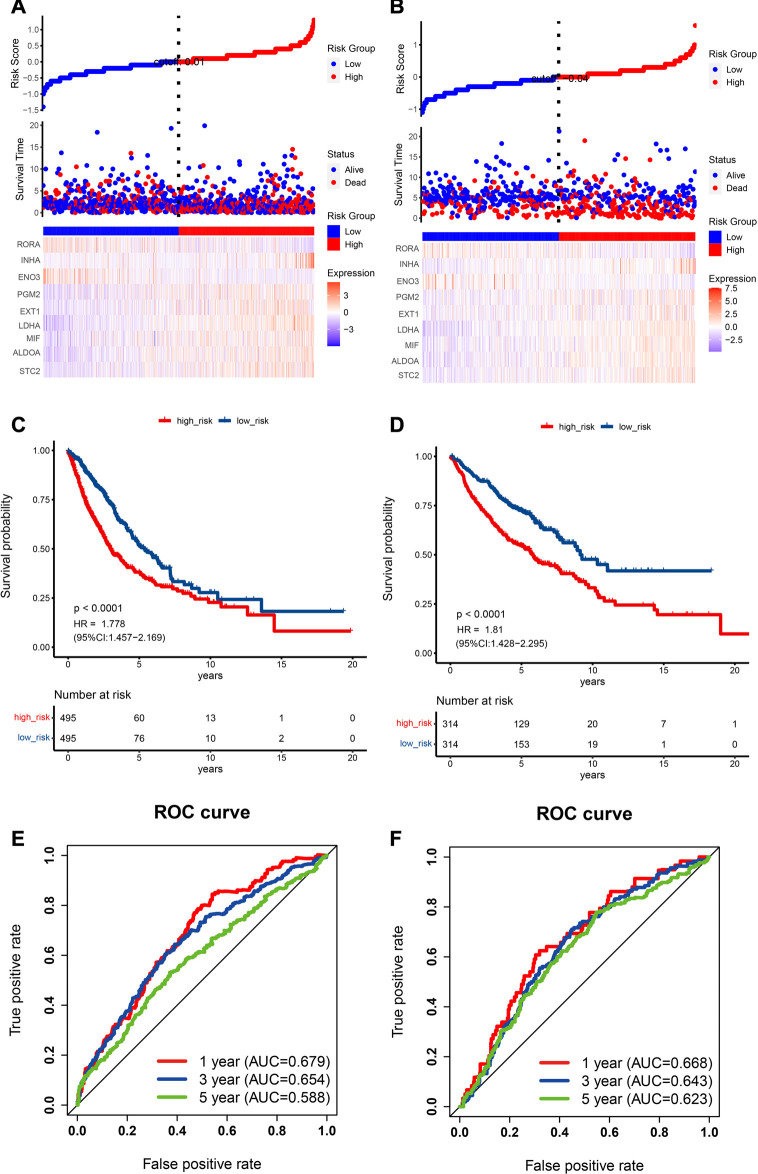
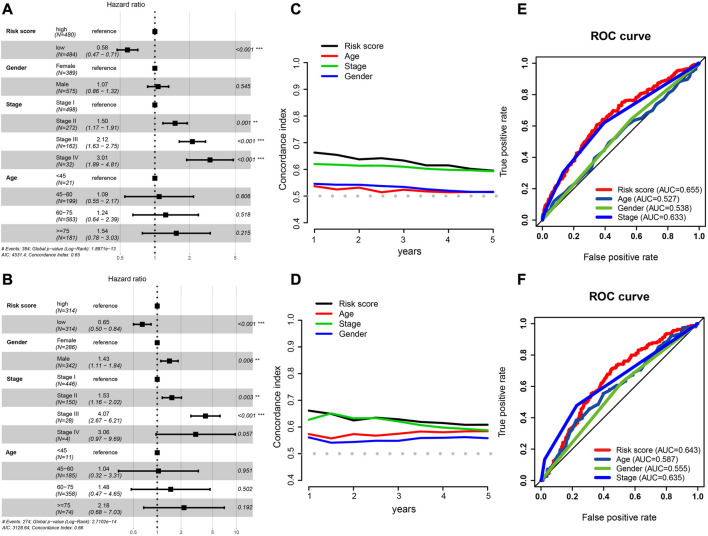
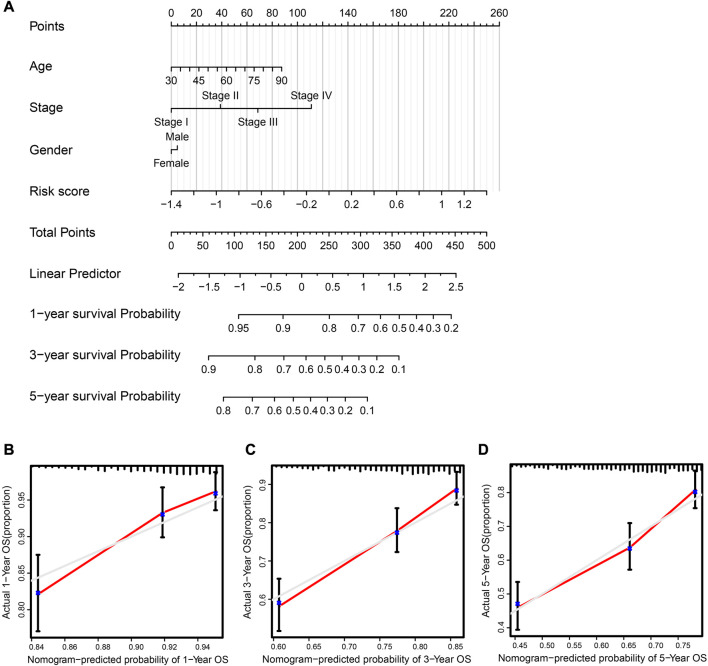
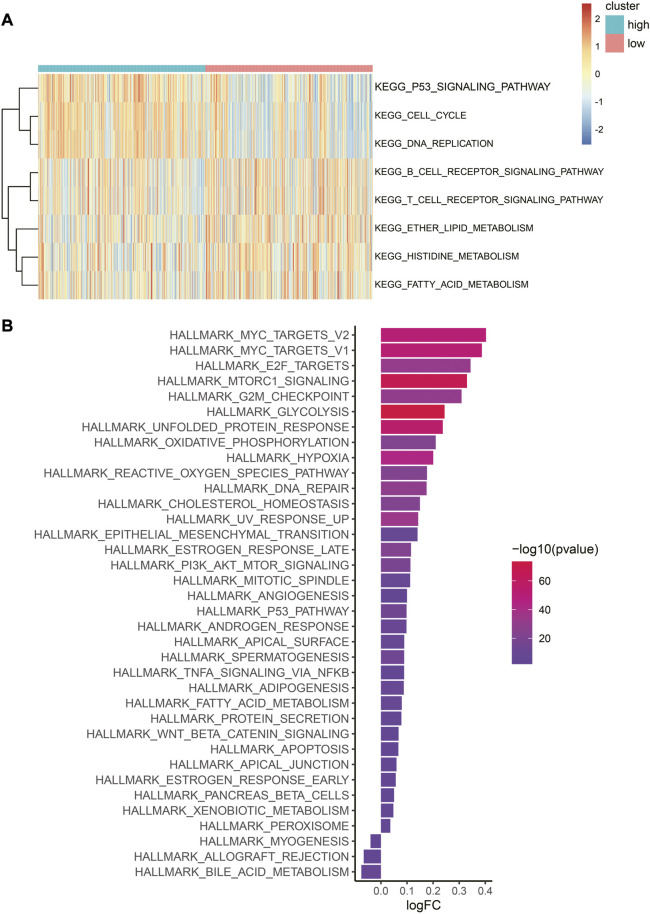
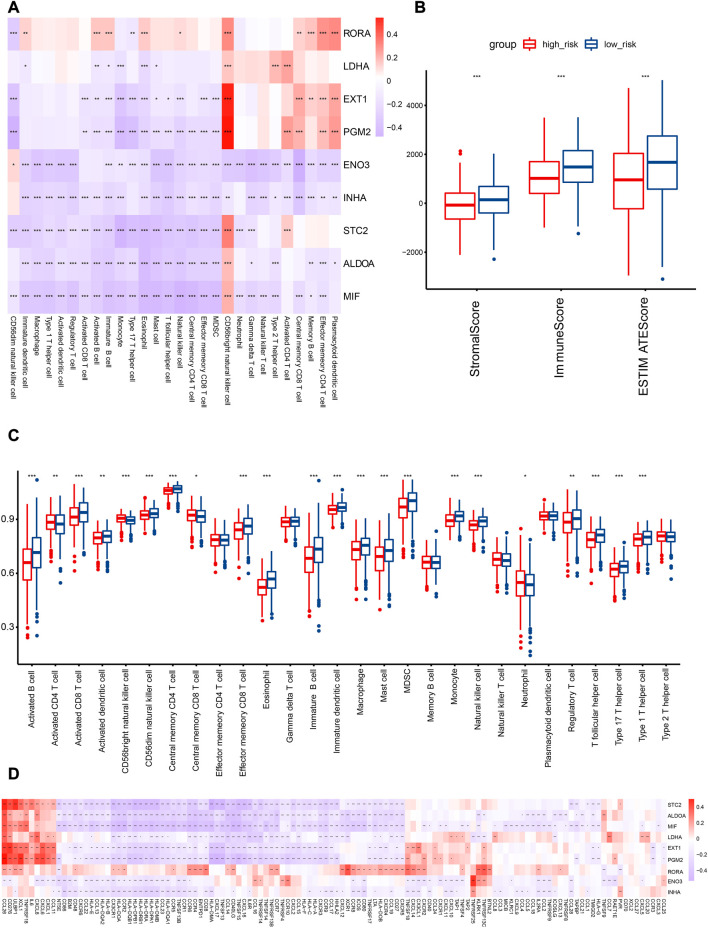
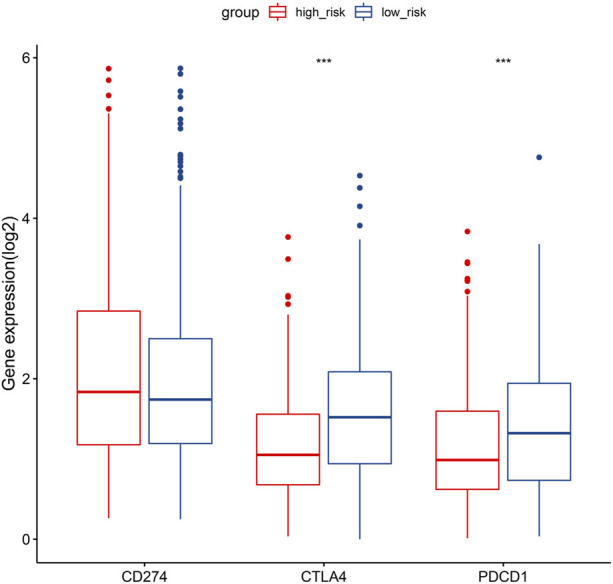
Background: Intratumoral hypoxia is widely associated with the development of malignancy, treatment resistance, and worse prognoses. The global influence of hypoxia-related genes (HRGs) on prognostic significance, tumor microenvironment characteristics, and therapeutic response is unclear in patients with non-small cell lung cancer (NSCLC). Method: RNA-seq and clinical data for NSCLC patients were derived from The Cancer Genome Atlas (TCGA) database, and a group of HRGs was obtained from the MSigDB. The differentially expressed HRGs were determined using the limma package; prognostic HRGs were identified via univariate Cox regression. Using the least absolute shrinkage and selection operator (LASSO) and multivariate Cox regression, an optimized prognostic model consisting of nine HRGs was constructed. The prognostic model's capacity was evaluated by Kaplan‒Meier survival curve analysis and receiver operating characteristic (ROC) curve analysis in the TCGA (training set) and GEO (validation set) cohorts. Moreover, a potential biological pathway and immune infiltration differences were explained. Results: A prognostic model containing nine HRGs (STC2, ALDOA, MIF, LDHA, EXT1, PGM2, ENO3, INHA, and RORA) was developed. NSCLC patients were separated into two risk categories according to the risk score generated by the hypoxia model. The model-based risk score had better predictive power than the clinicopathological method. Patients in the high-risk category had poor recurrence-free survival in the TCGA (HR: 1.426; 95% CI: 0.997-2.042; p = 0.046) and GEO (HR: 2.4; 95% CI: 1.7-3.2; p < 0.0001) cohorts. The overall survival of the high-risk category was also inferior to that of the low-risk category in the TCGA (HR: 1.8; 95% CI: 1.5-2.2; p < 0.0001) and GEO (HR: 1.8; 95% CI: 1.4-2.3; p < 0.0001) cohorts. Additionally, we discovered a notable distinction in the enrichment of immune-related pathways, immune cell abundance, and immune checkpoint gene expression between the two subcategories. Conclusion: The proposed 9-HRG signature is a promising indicator for predicting NSCLC patient prognosis and may be potentially applicable in checkpoint therapy efficiency prediction.
Keywords: NSCLC; hypoxia; immune microenvironment; immunotherapy; prognosis.
Copyright © 2023 Li, Cui, Zhang, Xu, Shao, Chen, Chen, Wang, Zeng, Zhang, Lu, Qian and Xing.
Conflict of interest statement
The authors declare that the research was conducted in the absence of any commercial or financial relationships that could be construed as a potential conflict of interest.
Figures
Similar articles
-
Identification of Hypoxia-Related Subtypes, Establishment of Prognostic Models, and Characteristics of Tumor Microenvironment Infiltration in Colon Cancer.Front Genet. 2022 Jun 17;13:919389. doi: 10.3389/fgene.2022.919389. eCollection 2022. Front Genet. 2022. PMID: 35783281 Free PMC article.
-
A Novel Defined Hypoxia-Related Gene Signature for Prognostic Prediction of Patients With Ewing Sarcoma.Front Genet. 2022 Jun 2;13:908113. doi: 10.3389/fgene.2022.908113. eCollection 2022. Front Genet. 2022. PMID: 35719404 Free PMC article.
-
A combined hypoxia and immune gene signature for predicting survival and risk stratification in triple-negative breast cancer.Aging (Albany NY). 2021 Aug 2;13(15):19486-19509. doi: 10.18632/aging.203360. Epub 2021 Aug 2. Aging (Albany NY). 2021. PMID: 34341184 Free PMC article.
-
Identification of a hypoxia-related gene prognostic signature in colorectal cancer based on bulk and single-cell RNA-seq.Sci Rep. 2023 Feb 13;13(1):2503. doi: 10.1038/s41598-023-29718-2. Sci Rep. 2023. PMID: 36781976 Free PMC article.
-
A Novel Hypoxia-Related Gene Signature with Strong Predicting Ability in Non-Small-Cell Lung Cancer Identified by Comprehensive Profiling.Int J Genomics. 2022 May 19;2022:8594658. doi: 10.1155/2022/8594658. eCollection 2022. Int J Genomics. 2022. PMID: 35634481 Free PMC article.
Cited by
-
Beyond ENO1, emerging roles and targeting strategies of other enolases in cancers.Mol Ther Oncolytics. 2023 Nov 10;31:100750. doi: 10.1016/j.omto.2023.100750. eCollection 2023 Dec 19. Mol Ther Oncolytics. 2023. PMID: 38075246 Free PMC article. Review.
-
Identification of the important role of CA9 in immune infiltration and prognosis in cervical cancer.Future Sci OA. 2025 Dec;11(1):2532314. doi: 10.1080/20565623.2025.2532314. Epub 2025 Jul 14. Future Sci OA. 2025. PMID: 40657793 Free PMC article.
-
UBE2T promotes stage I lung adenocarcinoma progression through PBX1 ubiquitination and PBX1/RORA regulation.BMC Cancer. 2024 Sep 18;24(1):1158. doi: 10.1186/s12885-024-12887-2. BMC Cancer. 2024. PMID: 39289660 Free PMC article.
References
LinkOut - more resources
Full Text Sources
Miscellaneous