

Integrative metabolomic and transcriptomic analysis reveals difference in glucose and lipid metabolism in the longissimus muscle of Luchuan and Duroc pigs
- PMID: 37091786
- PMCID: PMC10118036
- DOI: 10.3389/fgene.2023.1128033
Integrative metabolomic and transcriptomic analysis reveals difference in glucose and lipid metabolism in the longissimus muscle of Luchuan and Duroc pigs
Abstract
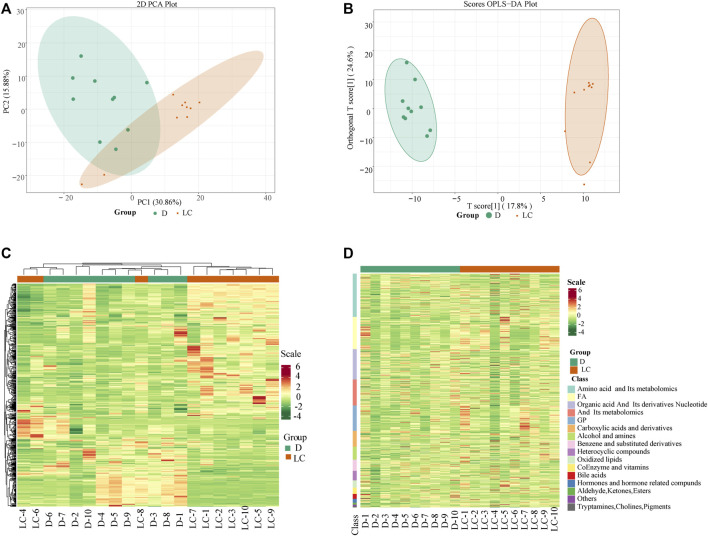
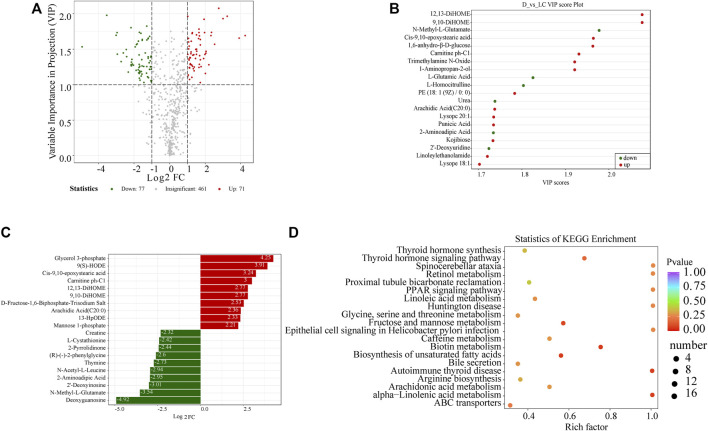
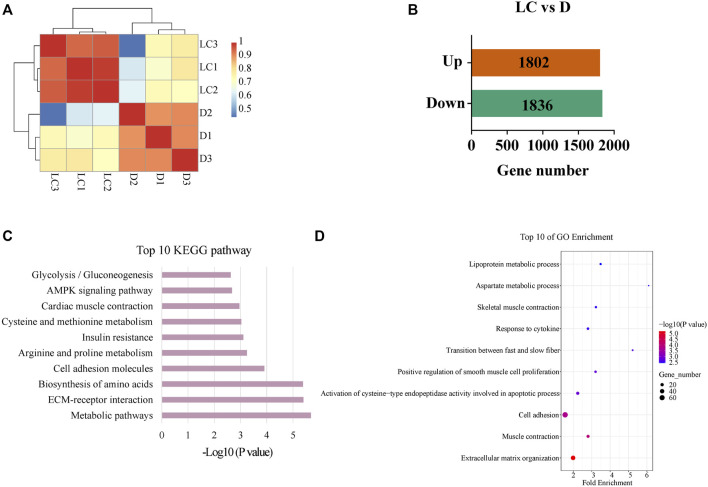
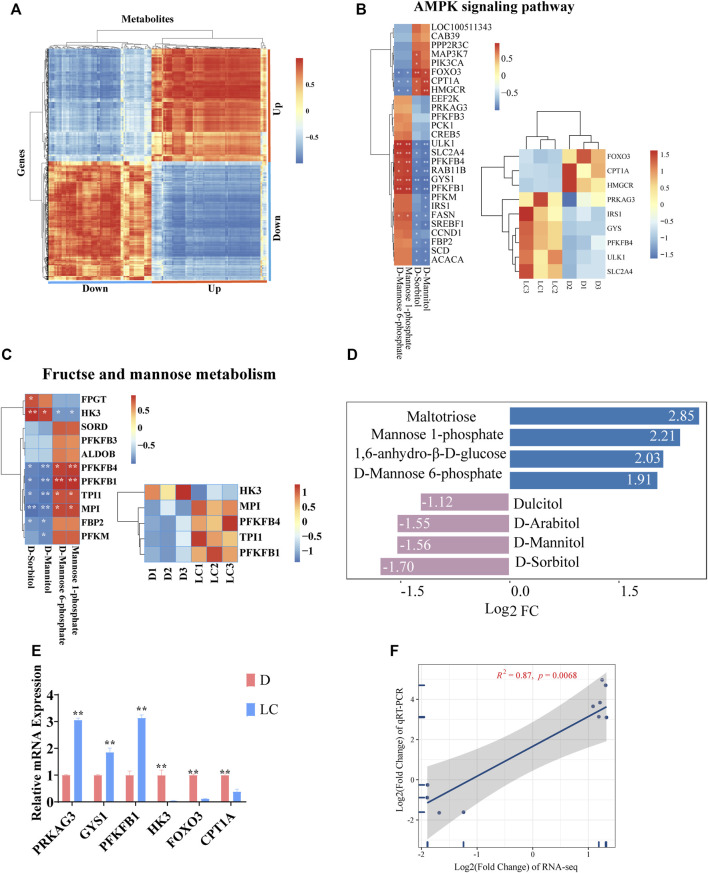
Luchuan pig, an obese indigenous Chinese porcine breed, has a desirable meat quality and reproductive capacity. Duroc, a traditional western breed, shows a faster growth rate, high feed efficiency and high lean meat rate. Given the unique features these two porcine breeds have, it is of interest to investigate the underlying molecular mechanisms behind their distinctive nature. In this study, the metabolic and transcriptomic profiles of longissimus dorsi muscle from Duroc and Luchuan pigs were compared. A total of 609 metabolites were identified, 77 of which were significantly decreased in Luchuan compared to Duroc, and 71 of which were significantly elevated. Most differentially accumulated metabolites (DAMs) upregulated in Luchuan were glycerophospholipids, fatty acids, oxidized lipids, alcohols, and amines, while metabolites downregulated in Luchuan were mostly amino acids, organic acids and nucleic acids, bile acids and hormones. From our RNA-sequencing (RNA-seq) data we identified a total of 3638 differentially expressed genes (DEGs), 1802 upregulated and 1836 downregulated in Luchuan skeletal muscle compared to Duroc. Combined multivariate and pathway enrichment analyses of metabolome and transcriptome results revealed that many of the DEGs and DAMs are associated with critical energy metabolic pathways, especially those related to glucose and lipid metabolism. We examined the expression of important DEGs in two pathways, AMP-activated protein kinase (AMPK) signaling pathway and fructose and mannose metabolism, using Real-Time Quantitative Reverse Transcription PCR (qRT-PCR). Genes related to glucose uptake, glycolysis, glycogen synthesis, fatty acid synthesis (PFKFB1, PFKFB4, MPI, TPI1, GYS1, SLC2A4, FASN, IRS1, ULK1) are more activated in Luchuan, while genes related to fatty acid oxidation, cholesterol synthesis (CPT1A, HMGCR, FOXO3) are more suppressed. Energy utilization can be a decisive factor to the distinctive metabolic, physiological and nutritional characteristics in skeletal muscle of the two breeds we studied. Our research may facilitate future porcine breeding projects and can be used to reveal the potential molecular basis of differences in complex traits between various breeds.
Keywords: AMPK signaling pathway; Duroc; Luchuan; RNA-seq; fructose and mannose metabolism; glycolysis; lipid metabolism; metabolic profiling.
Copyright © 2023 Deng, Li, Liu, Liu, Xie, Groenen, Madsen, Yang and Tang.
Conflict of interest statement
The authors declare that the research was conducted in the absence of any commercial or financial relationships that could be construed as a potential conflict of interest.
Figures
Similar articles
-
Identification of Differentially Expressed Genes in the Longissimus Dorsi Muscle of Luchuan and Duroc Pigs by Transcriptome Sequencing.Genes (Basel). 2023 Jan 3;14(1):132. doi: 10.3390/genes14010132. Genes (Basel). 2023. PMID: 36672873 Free PMC article.
-
Lipidomic and Transcriptomic Analysis of the Longissimus Muscle of Luchuan and Duroc Pigs.Front Nutr. 2021 May 7;8:667622. doi: 10.3389/fnut.2021.667622. eCollection 2021. Front Nutr. 2021. PMID: 34055857 Free PMC article.
-
Transcriptome Analysis of the Adipose Tissue of Luchuan and Duroc Pigs.Animals (Basel). 2022 Aug 31;12(17):2258. doi: 10.3390/ani12172258. Animals (Basel). 2022. PMID: 36077979 Free PMC article.
-
Comparative analysis of translatomics and transcriptomics in the longissimus dorsi muscle of Luchuan and Duroc pigs.PLoS One. 2025 Mar 18;20(3):e0319399. doi: 10.1371/journal.pone.0319399. eCollection 2025. PLoS One. 2025. PMID: 40100799 Free PMC article.
-
Integrative ATAC-seq and RNA-seq Analysis of the Longissimus Muscle of Luchuan and Duroc Pigs.Front Nutr. 2021 Sep 29;8:742672. doi: 10.3389/fnut.2021.742672. eCollection 2021. Front Nutr. 2021. PMID: 34660666 Free PMC article.
Cited by
-
Integrated transcriptomics and metabolomics reveal the molecular characteristics and metabolic regulatory mechanisms among different muscles in Minxian black fur sheep.BMC Genomics. 2025 Apr 29;26(1):412. doi: 10.1186/s12864-025-11607-9. BMC Genomics. 2025. PMID: 40301745 Free PMC article.
-
Proteomics integrated with metabolomics: Analysis of the internal mechanism underlying changes in meat quality in different muscles from bactrian camels.Food Chem X. 2025 Feb 11;26:102230. doi: 10.1016/j.fochx.2025.102230. eCollection 2025 Feb. Food Chem X. 2025. PMID: 40027112 Free PMC article.
-
Comprehensive Atlas of Alternative Splicing Reveals NSRP1 Promoting Adipogenesis through CCDC18.Int J Mol Sci. 2024 Mar 1;25(5):2874. doi: 10.3390/ijms25052874. Int J Mol Sci. 2024. PMID: 38474122 Free PMC article.
-
Expression Profile and Regulatory Properties of m6A-Modified circRNAs in the Longissimus Dorsi of Queshan Black and Large White Pigs.Animals (Basel). 2023 Jul 4;13(13):2190. doi: 10.3390/ani13132190. Animals (Basel). 2023. PMID: 37443988 Free PMC article.
References
-
- Chen W., Gong L., Guo Z. L., Wang W. S., Zhang H. Y., Liu X. Q., et al. (2013). A novel integrated method for large-scale detection, identification, and quantification of widely targeted metabolites: Application in the study of rice metabolomics. Mol. Plant 6 (6), 1769–1780. 10.1093/mp/sst080 - DOI - PubMed
Associated data
LinkOut - more resources
Full Text Sources
Research Materials
Miscellaneous