

Clinical efficacy of Yiqi Yangxue formula on knee osteoarthritis and unraveling therapeutic mechanism through plasma metabolites in rats
- PMID: 37091797
- PMCID: PMC10113924
- DOI: 10.3389/fgene.2023.1096616
Clinical efficacy of Yiqi Yangxue formula on knee osteoarthritis and unraveling therapeutic mechanism through plasma metabolites in rats
Abstract
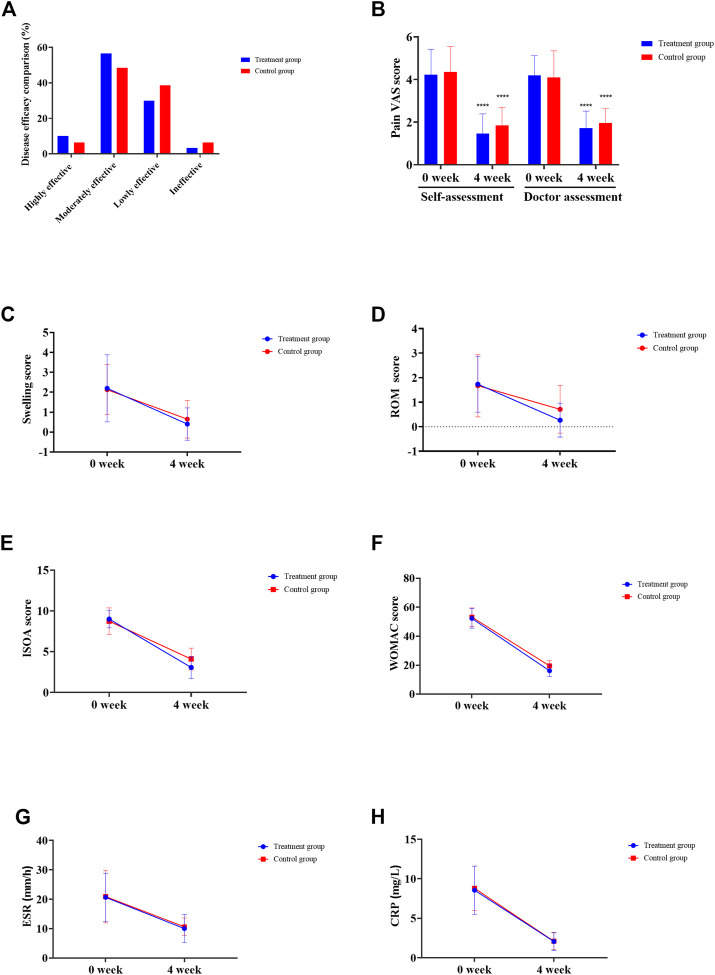
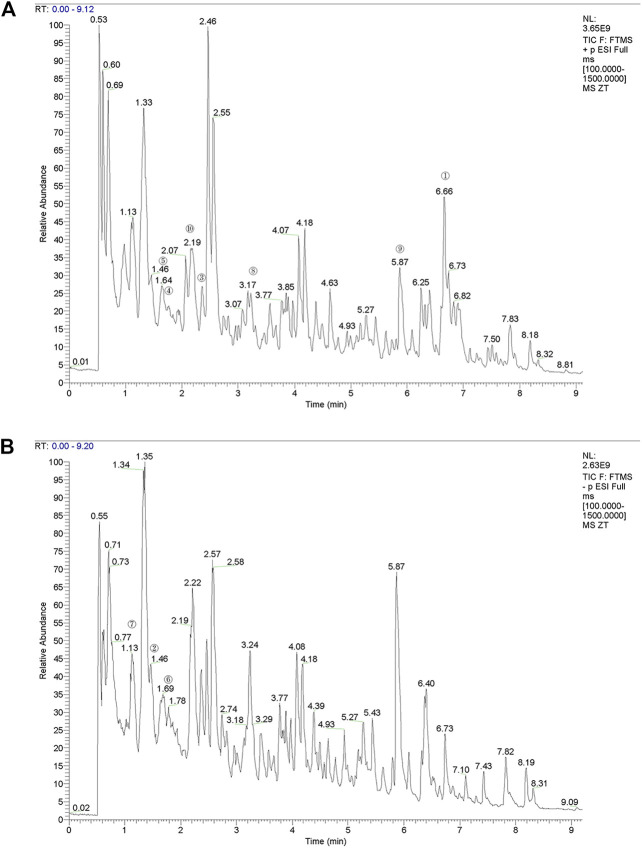
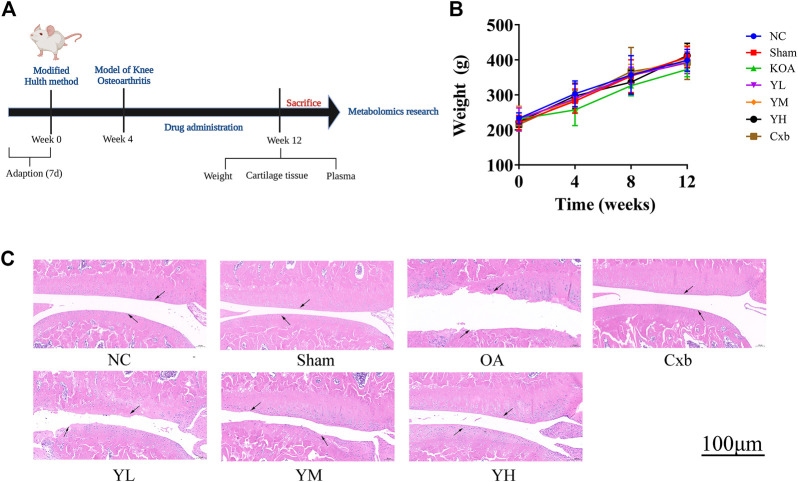
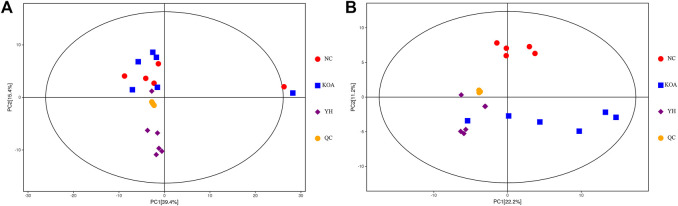
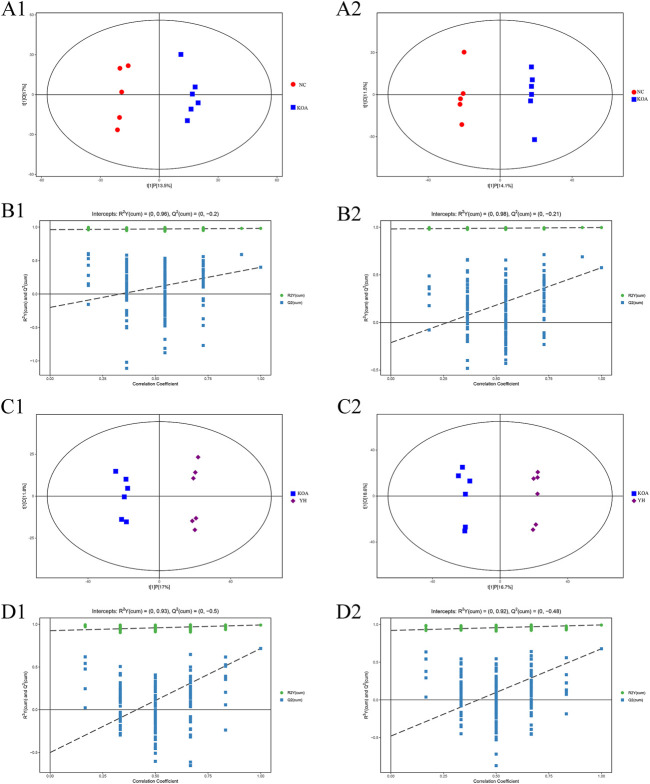
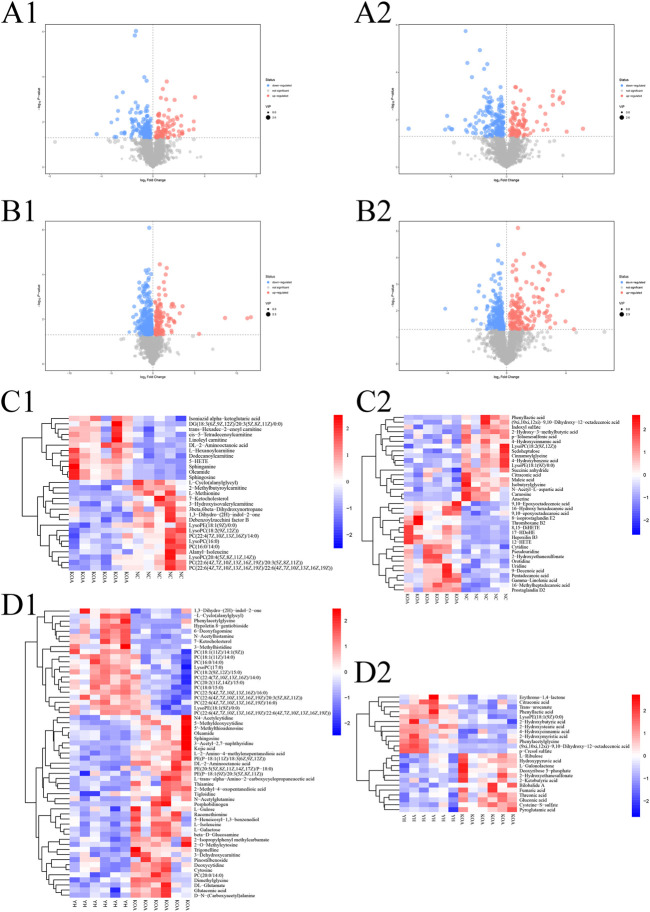
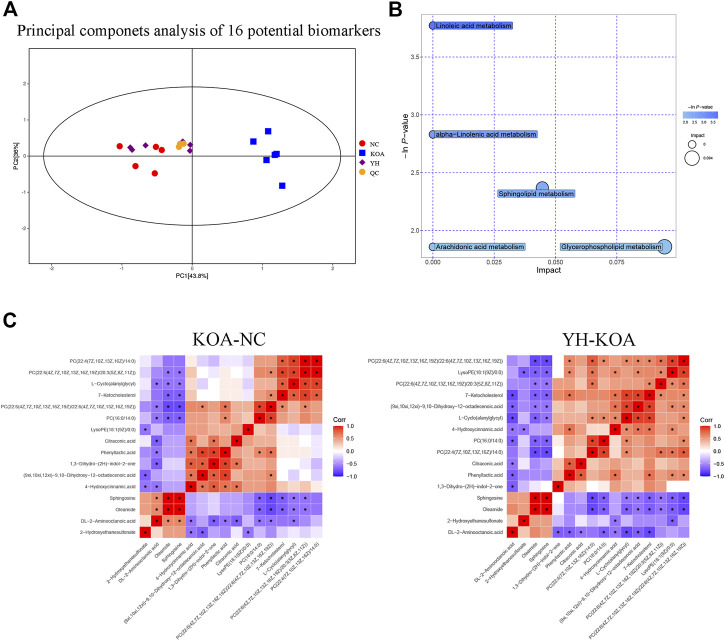
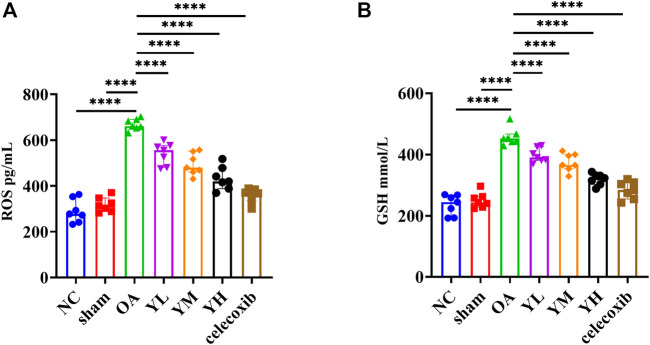
Objective: To observe the clinical efficacy and safety of Yiqi Yangxue formula (YQYXF) on knee osteoarthritis (KOA), and to explore the underlying therapeutic mechanism of YQYXF through endogenous differential metabolites and their related metabolic pathways. Methods: A total of 61 KOA patients were recruited and divided into the treatment group (YQYXF, 30 cases) and the control group (celecoxib, Cxb, 31 cases). Effects of these two drugs on joint pain, swelling, erythrocyte sedimentation rate (ESR) and c-reactive protein (CRP) were observed, and their safety and adverse reactions were investigated. In animal experiments, 63 SD rats were randomly divided into normal control (NC) group, sham operation (sham) group, model (KOA) group, Cxb group, as well as low-dose (YL), medium-dose (YM), and high-dose groups of YQYXF (YH). The KOA rat model was established using a modified Hulth method. Ultra-high-performance liquid chromatography/Q Exactive HF-X Hybrid Quadrupole-Orbitrap Mass (UHPLC-QE-MS)-based metabolomics technology was used to analyze the changes of metabolites in plasma samples of rats. Comprehensive (VIP) >1 and t-test p < 0.05 conditions were used to screen the disease biomarkers of KOA, and the underlying mechanisms of YQYXF were explored through metabolic pathway enrichment analysis. The related markers of YQYXF were further verified by ELISA (enzyme-linked immunosorbent assay). Results: YQYXF can improve joint pain, swelling, range of motion, joint function, Michel Lequesen index of severity for osteoarthritis (ISOA) score, Western Ontario and McMaster Universities Osteoarthritis Index (WOMAC) score, ESR, and CRP. No apparent adverse reactions were reported. In addition, YQYXF can improve cartilage damage in KOA rats, reverse the abnormal changes of 16 different metabolites, and exert an anti-KOA effect mainly through five metabolic pathways. The levels of reactive oxygen species (ROS) and glutathione (GSH) were significantly decreased after the treatment of YQYXF. Conclusion: YQYXF can significantly improve the clinical symptoms of KOA patients without obvious adverse reactions. It mainly improved KOA through modulating lipid metabolism-related biomarkers, reducing lipid peroxidation and oxidative stress.
Keywords: YQYXF; biomarkers; clinical efficacy; knee osteoarthritis; metabolome.
Copyright © 2023 Zhao, Wang, Liu, Shen, Dai, Shi, Huang, Wei, Li, Zhang, Xie, Wang, Qin and Li.
Conflict of interest statement
The authors declare that the research was conducted in the absence of any commercial or financial relationships that could be construed as a potential conflict of interest.
Figures
Similar articles
-
Yiqi Yangxue formula inhibits cartilage degeneration in knee osteoarthritis by regulating LncRNA-UFC1/miR-34a/MMP-13 axis.J Ethnopharmacol. 2025 Jan 30;337(Pt 3):118930. doi: 10.1016/j.jep.2024.118930. Epub 2024 Oct 10. J Ethnopharmacol. 2025. PMID: 39393561
-
Clinical and Animal Studies of Waist and Knee Scraping Therapy for Knee Osteoarthritis.Comb Chem High Throughput Screen. 2024;27(15):2278-2294. doi: 10.2174/0113862073264397231228054318. Comb Chem High Throughput Screen. 2024. PMID: 38284729 Clinical Trial.
-
Effect of moxibustion on plasma amino acid metabolism in rats with knee osteoarthritis.Zhen Ci Yan Jiu. 2024 Aug 25;49(8):797-804. doi: 10.13702/j.1000-0607.20230860. Zhen Ci Yan Jiu. 2024. PMID: 39318308 Chinese, English.
-
The Efficacy and Safety of Chinese Herbal Medicine in the Treatment of Knee Osteoarthritis: An Updated Systematic Review and Meta-Analysis of 56 Randomized Controlled Trials.Oxid Med Cell Longev. 2022 Jan 7;2022:6887988. doi: 10.1155/2022/6887988. eCollection 2022. Oxid Med Cell Longev. 2022. PMID: 35035664 Free PMC article.
-
The Effectiveness and Safety of Moxibustion for Treating Knee Osteoarthritis: A PRISMA Compliant Systematic Review and Meta-Analysis of Randomized Controlled Trials.Pain Res Manag. 2019 Dec 17;2019:2653792. doi: 10.1155/2019/2653792. eCollection 2019. Pain Res Manag. 2019. PMID: 31949547 Free PMC article.
References
-
- Abbott J. H., Robertson M. C., Chapple C., Pinto D., Wright A. A., Leon de la Barra S., et al. (2013). Manual therapy, exercise therapy, or both, in addition to usual care, for osteoarthritis of the hip or knee: A randomized controlled trial. 1: Clinical effectiveness. Osteoarthr. Cartil. 21, 525–534. 10.1016/j.joca.2012.12.014 - DOI - PubMed
-
- Carlson A. K., Rawle R. A., Wallace C. W., Brooks E. G., Adams E., Greenwood M. C., et al. (2019). Characterization of synovial fluid metabolomic phenotypes of cartilage morphological changes associated with osteoarthritis. Osteoarthr. Cartil. 27, 1174–1184. 10.1016/j.joca.2019.04.007 - DOI - PMC - PubMed
LinkOut - more resources
Full Text Sources
Molecular Biology Databases
Research Materials
Miscellaneous