PUS1 May Be a Potential Prognostic Biomarker and Therapeutic Target for Hepatocellular Carcinoma
- PMID: 37091827
- PMCID: PMC10115212
- DOI: 10.2147/PGPM.S405621
PUS1 May Be a Potential Prognostic Biomarker and Therapeutic Target for Hepatocellular Carcinoma
Abstract
Objective: The mechanisms of pseudouridine synthase (PUS) are not definite in hepatocellular carcinoma (HCC), the objective of this study is to investigate the effect of PUS genes in HCC.
Materials and methods: Differentially expressed and prognostic gene of PUS enzymes was identified based on The Cancer Genome Atlas (TCGA), International Cancer Genome Consortium (ICGC) and Gene Expression Profiling Interactive Analysis (GEPIA) databases. For the identified gene, pseudouridine synthase 1 (PUS1), was used for further research. The clinicopathological feature of PUS1 was analyzed by Student's t-test. Prognostic significance was explored by Kaplan-Meier (KM) analysis and Cox proportional hazards regression model. Receiver operating characteristic (ROC) curve was applied to appraise diagnostic and prognostic value. The Database for Annotation, Visualization, and Integrated Discovery (DAVID) and Gene Set Enrichment Analysis (GSEA) were implemented to explore mechanism of PUS1. A Guangxi cohort was applied to verify differential expression. In vitro cell experiments were implemented to investigate the influence for proliferation, reactive oxygen species (ROS) level, migration, and invasion of HCC cells after a knockdown of PUS1.
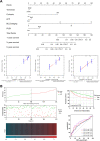
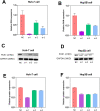
Results: PUS1 was significantly overexpressed in HCC tissues, and patients with high PUS1 were related to unpromising clinicopathological features. Survival analysis revealed high PUS1 expression was associated with a poor overall survival (OS) and 1 year-recurrence free survival (RFS), was an independent risk factor. Meanwhile, ROC curve showed that PUS1 had a diagnostic and prognostic significance to HCC. Functional enrichment analysis implied that PUS1 may be involved in metabolic pathways, mitochondrial function, non-alcoholic fatty liver disease (NAFLD), and some important carcinogenic pathways. Cell assays revealed that knockdown of PUS1 significantly constrained the migration, proliferation, invasion and improved the ROS level of HCC cells.
Conclusion: PUS1 may be a prognostic biomarker and a underlying treatment target for HCC.
Keywords: HCC; PUS1; gene knockout; poor prognosis; pseudouridine synthase.
© 2023 Lan et al.
Conflict of interest statement
The authors report no conflicts of interest in this work.
Figures


Similar articles
-
Integrative multiomics evaluation reveals the importance of pseudouridine synthases in hepatocellular carcinoma.Front Genet. 2022 Nov 10;13:944681. doi: 10.3389/fgene.2022.944681. eCollection 2022. Front Genet. 2022. PMID: 36437949 Free PMC article.
-
Pseudouridine synthase 1 promotes progression of hepatocellular carcinoma via mTOR and MYC signaling pathways.Front Oncol. 2025 Mar 18;15:1576651. doi: 10.3389/fonc.2025.1576651. eCollection 2025. Front Oncol. 2025. PMID: 40171259 Free PMC article.
-
Mining prognostic markers of Asian hepatocellular carcinoma patients based on the apoptosis-related genes.BMC Cancer. 2021 Feb 18;21(1):175. doi: 10.1186/s12885-021-07886-6. BMC Cancer. 2021. PMID: 33602168 Free PMC article.
-
High expression of PDZ-binding kinase is correlated with poor prognosis and immune infiltrates in hepatocellular carcinoma.World J Surg Oncol. 2022 Jan 22;20(1):22. doi: 10.1186/s12957-021-02479-w. World J Surg Oncol. 2022. PMID: 35065633 Free PMC article.
-
Overexpressed PAQR4 predicts poor overall survival and construction of a prognostic nomogram based on PAQR family for hepatocellular carcinoma.Math Biosci Eng. 2022 Jan 19;19(3):3069-3090. doi: 10.3934/mbe.2022142. Math Biosci Eng. 2022. PMID: 35240821
Cited by
-
Biomarker Discovery in Liver Disease Using Untargeted Metabolomics in Plasma and Saliva.Int J Mol Sci. 2024 Sep 21;25(18):10144. doi: 10.3390/ijms251810144. Int J Mol Sci. 2024. PMID: 39337628 Free PMC article.
-
Maternally Inherited Essential Hypertension May Be Associated with the Mutations in Mitochondrial tRNAGlu Gene.Pharmgenomics Pers Med. 2024 Jan 9;17:13-26. doi: 10.2147/PGPM.S436235. eCollection 2024. Pharmgenomics Pers Med. 2024. PMID: 38222291 Free PMC article.
-
Transcriptomic profile of RNA pseudouridine modification as a biomarker for cellular senescence associated with survival outcomes in colorectal cancer.BMC Biol. 2025 Feb 27;23(1):61. doi: 10.1186/s12915-025-02170-6. BMC Biol. 2025. PMID: 40016751 Free PMC article.
-
Advancements in pseudouridine modifying enzyme and cancer.Front Cell Dev Biol. 2024 Dec 16;12:1465546. doi: 10.3389/fcell.2024.1465546. eCollection 2024. Front Cell Dev Biol. 2024. PMID: 39737343 Free PMC article. Review.
References
LinkOut - more resources
Full Text Sources

