

DNA methylation enzymes in the kidneys of male and female BTBR ob/ob mice
- PMID: 37091852
- PMCID: PMC10113614
- DOI: 10.3389/fendo.2023.1167546
DNA methylation enzymes in the kidneys of male and female BTBR ob/ob mice
Abstract
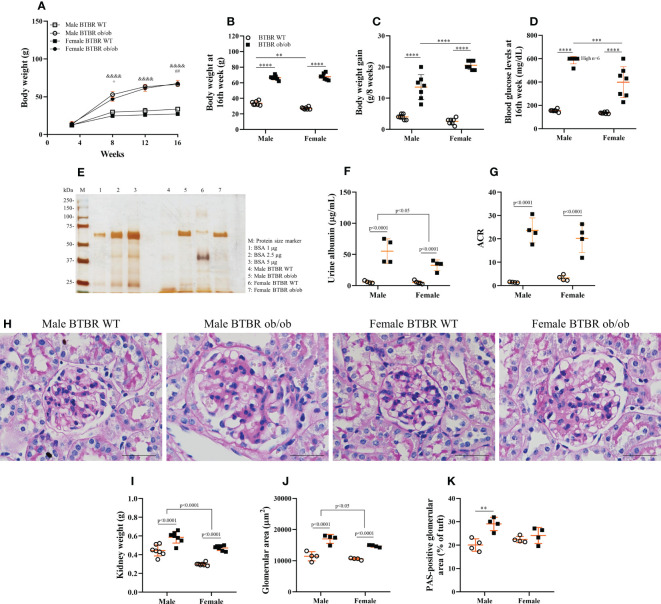
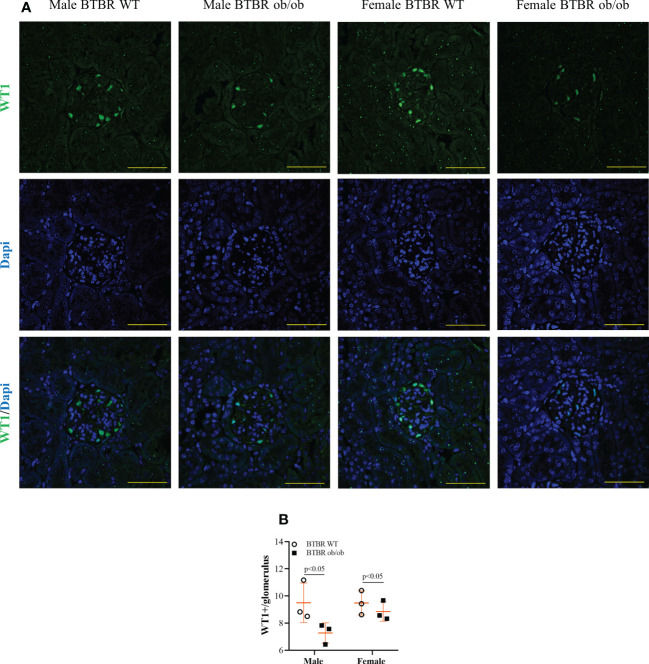
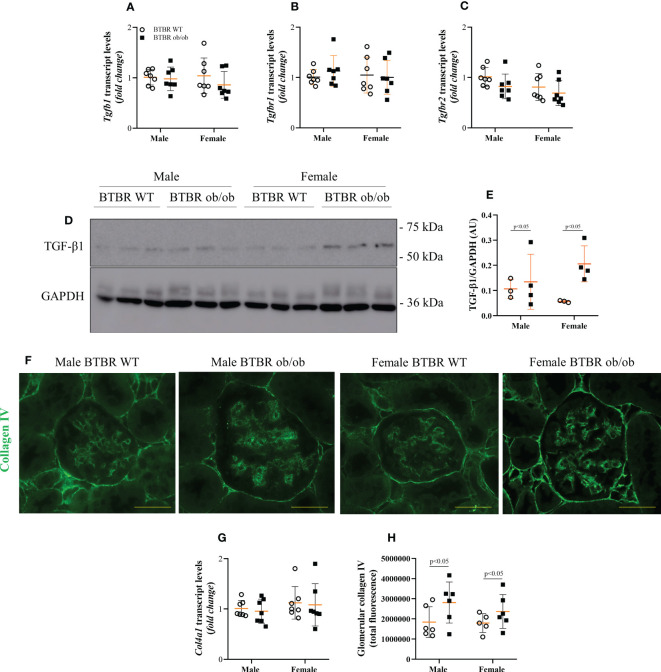
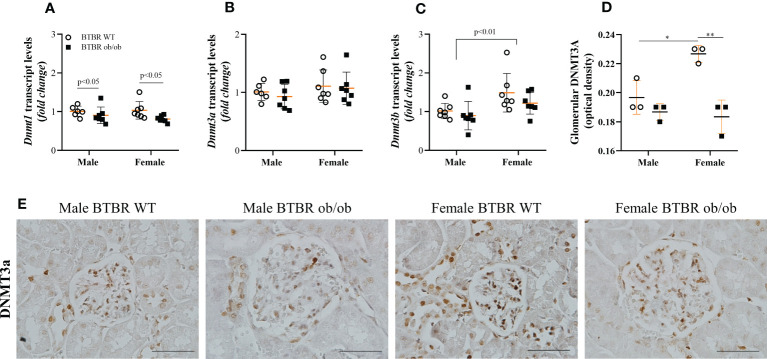
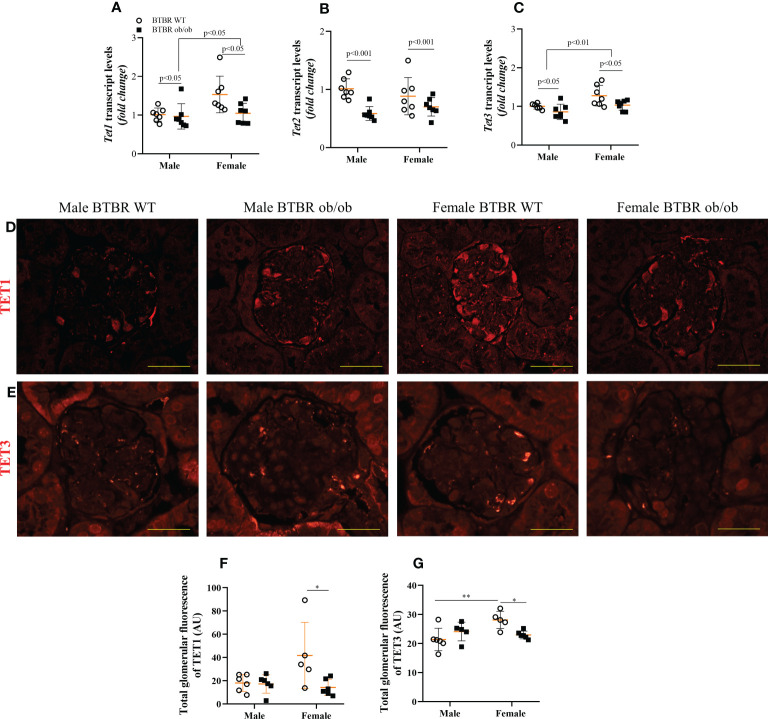
Diabetic kidney disease (DKD) is the leading cause of the end-stage renal disease. Recent studies have shown that epigenetic modifications contribute to alterations in gene expression and the development of DKD. This study aimed to show an expression profile of key DNA (de)methylation enzymes (DNMT, TET proteins) and their differences between sexes under obesity and diabetic condition. Male and female black and tan brachyury (BTBR) ob/ob mice and their corresponding wild-type littermates (BTBR WT) were studied until 16 weeks of age. Metabolic parameters, kidney morphophysiology and the expression of fibrotic markers and epigenetic enzymes were studied in whole kidney tissue or specifically in the glomerulus. The results showed sexual dimorphism in the development of metabolic disease and in kidney morphophysiology. Female mice have a different profile of DNMTs expression in both WT and obese/diabetic condition. Furthermore, metabolic condition negatively modulated the glomerular expression of TET1 and TET3 only in females. To our knowledge, this is the first study that shows a kidney profile of the expression of key (de)methylation enzymes, DNMTs and TETs, in the BTBR ob/ob experimental model of DKD and its association with sex. The knowledge of this epigenetic profile may help future research to understand the pathophysiology of DKD in males and females.
Keywords: DNMT; TET; chronic kidney disease; epigenetics; obesity and diabetes.
Copyright © 2023 Veloso Pereira, Charleaux de Ponte, Malavolta Luz and Thieme.
Conflict of interest statement
The authors declare that the research was conducted in the absence of any commercial or financial relationships that could be construed as a potential conflict of interest.
Figures
Similar articles
-
Human carnosinase 1 overexpression aggravates diabetes and renal impairment in BTBROb/Ob mice.J Mol Med (Berl). 2020 Sep;98(9):1333-1346. doi: 10.1007/s00109-020-01957-0. Epub 2020 Aug 15. J Mol Med (Berl). 2020. PMID: 32803273 Free PMC article.
-
Effects of CP-900691, a novel peroxisome proliferator-activated receptor α, agonist on diabetic nephropathy in the BTBR ob/ob mouse.Lab Invest. 2014 Aug;94(8):851-62. doi: 10.1038/labinvest.2014.80. Epub 2014 Jun 23. Lab Invest. 2014. PMID: 24955894 Free PMC article.
-
The SGLT2 inhibitor empagliflozin ameliorates early features of diabetic nephropathy in BTBR ob/ob type 2 diabetic mice with and without hypertension.Am J Physiol Renal Physiol. 2014 Aug 1;307(3):F317-25. doi: 10.1152/ajprenal.00145.2014. Epub 2014 Jun 18. Am J Physiol Renal Physiol. 2014. PMID: 24944269
-
DNA methylation and the potential role of demethylating agents in prevention of progressive chronic kidney disease.FASEB J. 2018 Oct;32(10):5215-5226. doi: 10.1096/fj.201800205R. Epub 2018 Apr 24. FASEB J. 2018. PMID: 29688808 Review.
-
Targeting DNA methylation in diabetic kidney disease: A new perspective.Life Sci. 2023 Dec 15;335:122256. doi: 10.1016/j.lfs.2023.122256. Epub 2023 Nov 9. Life Sci. 2023. PMID: 37949210 Review.
Cited by
-
Ten-Eleven Translocation Family Proteins: Structure, Biological Functions, Diseases, and Targeted Therapy.MedComm (2020). 2025 Jul 1;6(7):e70245. doi: 10.1002/mco2.70245. eCollection 2025 Jul. MedComm (2020). 2025. PMID: 40599235 Free PMC article. Review.
-
Epigenetic modifications in obesity-associated diseases.MedComm (2020). 2024 Feb 24;5(2):e496. doi: 10.1002/mco2.496. eCollection 2024 Feb. MedComm (2020). 2024. PMID: 38405061 Free PMC article. Review.
-
Role of Sex Hormones in Prevalent Kidney Diseases.Int J Mol Sci. 2023 May 4;24(9):8244. doi: 10.3390/ijms24098244. Int J Mol Sci. 2023. PMID: 37175947 Free PMC article. Review.
-
Maternal Serum and Cord Blood Leptin Concentrations in African Newborns: Relationship to Birth Weight and Gender.Nutrients. 2025 Jan 30;17(3):515. doi: 10.3390/nu17030515. Nutrients. 2025. PMID: 39940373 Free PMC article.
References
-
- Foreman KJ, Marquez N, Dolgert A, Fukutaki K, Fullman N, McGaughey M, et al. . Forecasting life expectancy, years of life lost, and all-cause and cause-specific mortality for 250 causes of death: Reference and alternative scenarios for 2016-40 for 195 countries and territories. Lancet (2018) 392(10159):2052–90. doi: 10.1016/S0140-6736(18)31694-5 - DOI - PMC - PubMed
Publication types
MeSH terms
LinkOut - more resources
Full Text Sources
Medical
Molecular Biology Databases
Miscellaneous