. 2023 Mar 27;9(1):vead024.
doi: 10.1093/ve/vead024. eCollection 2023.

Non-structural genes of novel lemur adenoviruses reveal codivergence of virus and host

Affiliations

Non-structural genes of novel lemur adenoviruses reveal codivergence of virus and host

Talitha Veith et al. Virus Evol. .

Abstract

Adenoviruses (AdVs) are important human and animal pathogens and are frequently used as vectors for gene therapy and vaccine delivery. Surprisingly, there are only scant data regarding primate AdV origin and evolution, especially in the most basal primate hosts. We detect and sequence AdVs from faeces of two Madagascan lemur species. Complete genome sequence analyses define a new AdV species with a particularly large gene encoding a protein of unknown function in the early gene region 3. Unexpectedly, the new AdV species is not most similar to human or other simian AdVs but to bat adenovirus C. Genome characterisation shows signals of virus-host codivergence in non-structural genes, which show lower diversity than structural genes. Outside a lemur species mixing zone, recombination less frequently separates structural genes, as in human adenovirus C. The evolutionary history of lemur AdVs likely involves both a host switch and codivergence with the lemur hosts.

Keywords: adenovirus; cospeciation; host-switch; primate; prosimian.


Conflict of interest statement

None declared.

Figures

Figure 1.
Figure 1.
The topographical map of sampling sites. Dark green refers to heights of 350–500 m, yellow to 550–650 m, red to 750–1,100 m, and grey to >1,100 m, with rivers marked in blue. Microcebus griseorufus is found at sites A and B, shown in dark red, and M. murinus at sites B and C, shown in light red. The number of AdV-positive samples at each site is given for each lemur species.
Figure 2.
Figure 2.
Genome organisation of LAdV ID 204 compared to (A) HAdV-1 along the complete genome and (B) compared to HAdV-1, TsAdV, and BtAdV-C in the organisation of the E3 region. The reference position is relative to HAdV-1. ‘x’ in LAdV denotes detected recombination breakpoints (Fig. S1). Genes in bold were used for PCR design for amplicon analysis (Figs 5–8).
Figure 3.
Figure 3.
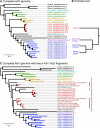
Maximum likelihood (ML) phylogenetic trees created using raxml-ng (Kozlov et al. 2019) with the substitution model GTR + I + G. (A) Complete genome nucleotide sequences. (B) A sketch of a simplified primate phylogenetic tree adapted from Yoder and Yang (2004), wherein the category of old-world monkeys excludes apes and humans. (C) Eleven published 252-bp IVa2 gene fragments from lemur AdVs are included in the phylogenetic tree. Branch BS between 70 and 90 is shown as a white circle and ≥90 as a black circle. All trees were rooted with aviadenoviruses and atadenoviruses (not shown).
Figure 4.
Figure 4.
Nucleotide distances along a complete genome alignment, comparing LAdV ID 400 as representative against BtAdV-C WIV10, TsAdV, TmAdV, and HAdV-1. The analysis was carried out with a sliding window size of 500 nucleotides and a step size of 150 nucleotides. The background colour represents the AdV most similar to LAdV ID 400 in each window.
Figure 5.
Figure 5.
Tanglegram sketches based on ML phylogenetic trees. (A) Non-structural genes, DNA polymerase as representative (B) Structural genes, hexon as representative. The M. griseorufus and M. murinus tree sketch is based on Poelstra et al. (2022). The complete trees and all tree sketches can be found in Figs S1 and S2. Dark red corresponds to M. griseorufus and light red to M. murinus. Only BS values > 70 are shown.
Figure 6.
Figure 6.
Root-to-tip patristic distances of ML trees for (A) individual gene fragments and (B) non-structural and structural genes. Error bars represent 1 standard deviation. A two-sided t-test with Bonferroni correction was performed, and **** denotes p-values < 0.0001.
Figure 7.
Figure 7.
The heatmap of clade assignment of six PCR sequence fragments for each LAdV, grouped by (A) non-recombinant (n = 31) and (B) recombinant (n = 24) LAdVs. The corresponding data can be found in Table S4, and these data were taken from the phylogenetic trees shown in Fig. S3. Five LAdVs were excluded from recombination analysis because we obtained only the sequence of the hexon gene. Wherever we were not able to generate PCR product and sequence data, the field is left empty, as the sequence is not available (n.a.).
Figure 8.
Figure 8.
(A) The map of sampling sites showing clade location. Western sites are in dark blue, eastern sites are in bright blue, and Clade III is in turquoise. (B) The boxes symbolise the seven clades. A line between them stands for the detection of patterns, suggesting recombination involving the two clades. (C) Average patristic nucleotide distances of each clade to the phylogenetically closest clade in geographic vicinity, separated by structural (s) and non-structural (non-s) genes and grouped into clades non-III and III. For Clade III, the most closely related clades are II (penton), II (hexon), V (fiber), VI (E1A), V (DNA pol), and VI (E4 34k). A two-sided t-test with Bonferroni correction was performed, ns denotes p-values > 0.05, and ** denotes p-values < 0.01. (D) The schematic of LAdV genome. Each connecting line indicates the location of one detected recombination breakpoint (Fig. 7 and Table S4). The potential recombination breakpoint lies anywhere between the two connected genes.

References

    1. Ai L. et al. (2022) ‘Genomic Characteristics and Pathogenicity of a New Bat Adenoviruses Strains that Was Isolated in at Sites along the Southeastern Coasts of the P. R. of China from 2015 to 2019’, Virus Research, 308: 198653. - PubMed
    1. Altschul S. F. et al. (1997) ‘Gapped BLAST and PSI-BLAST: A New Generation of Protein Database Search Programs’, Nucleic Acids Research, 25: 3389–402. - PMC - PubMed
    1. Andriamandimbiarisoa L. et al. (2015) ‘Habitat Corridor Utilization by the Gray Mouse Lemur, Microcebus Murinus, in the Littoral Forest Fragments of Southeastern Madagascar’, Madagascar Conservation and Development 10: 144–50.
    1. Benkő M. et al. (2022) ‘ICTV Virus Taxonomy Profile: 2022’, The Journal of General Virology, 103: 001721. - PMC - PubMed
    1. Bergeron L. A. et al. (2023) ‘Evolution of the Germline Mutation Rate across Vertebrates’, Nature 615: 285–91. - PMC - PubMed