. 2023 Apr 7:11:1173688.
doi: 10.3389/fcell.2023.1173688. eCollection 2023.

Balancing WNT signalling in early forebrain development: The role of LRP4 as a modulator of LRP6 function

Affiliations

Balancing WNT signalling in early forebrain development: The role of LRP4 as a modulator of LRP6 function

Shuang Geng et al. Front Cell Dev Biol. .

Abstract

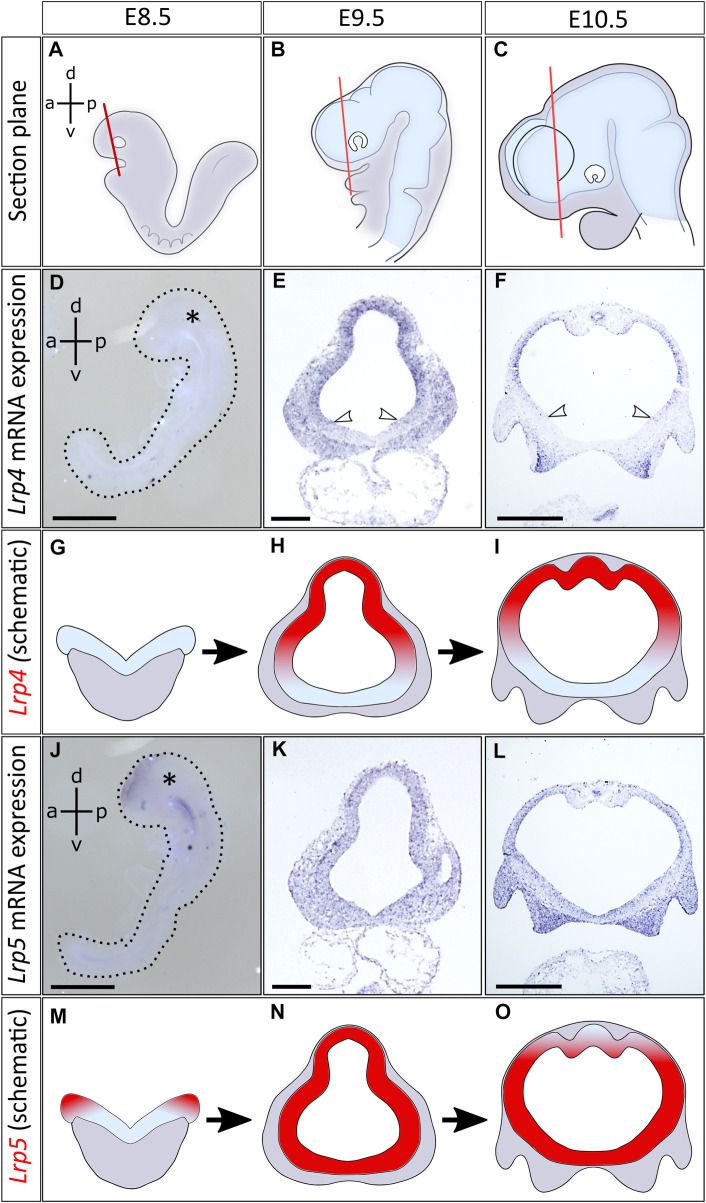
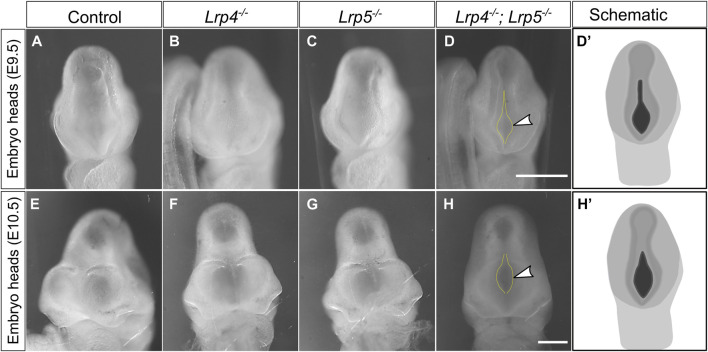
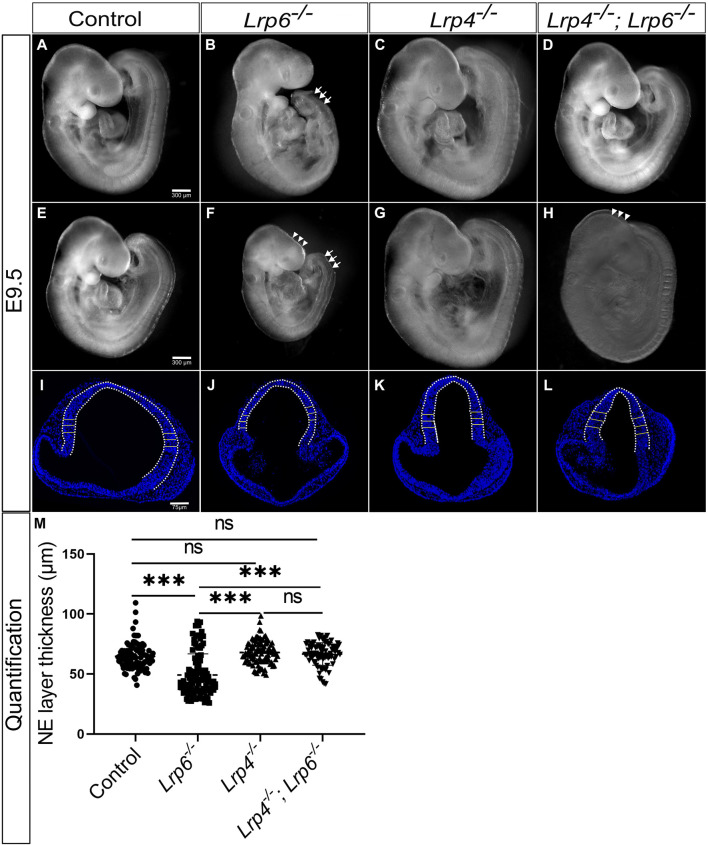
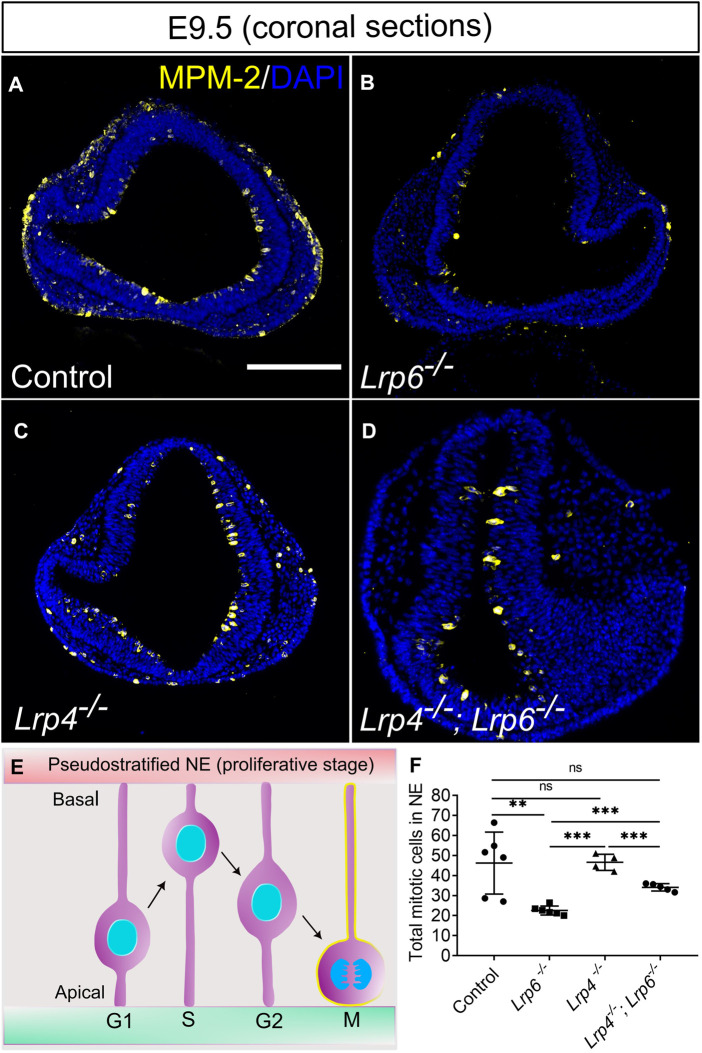
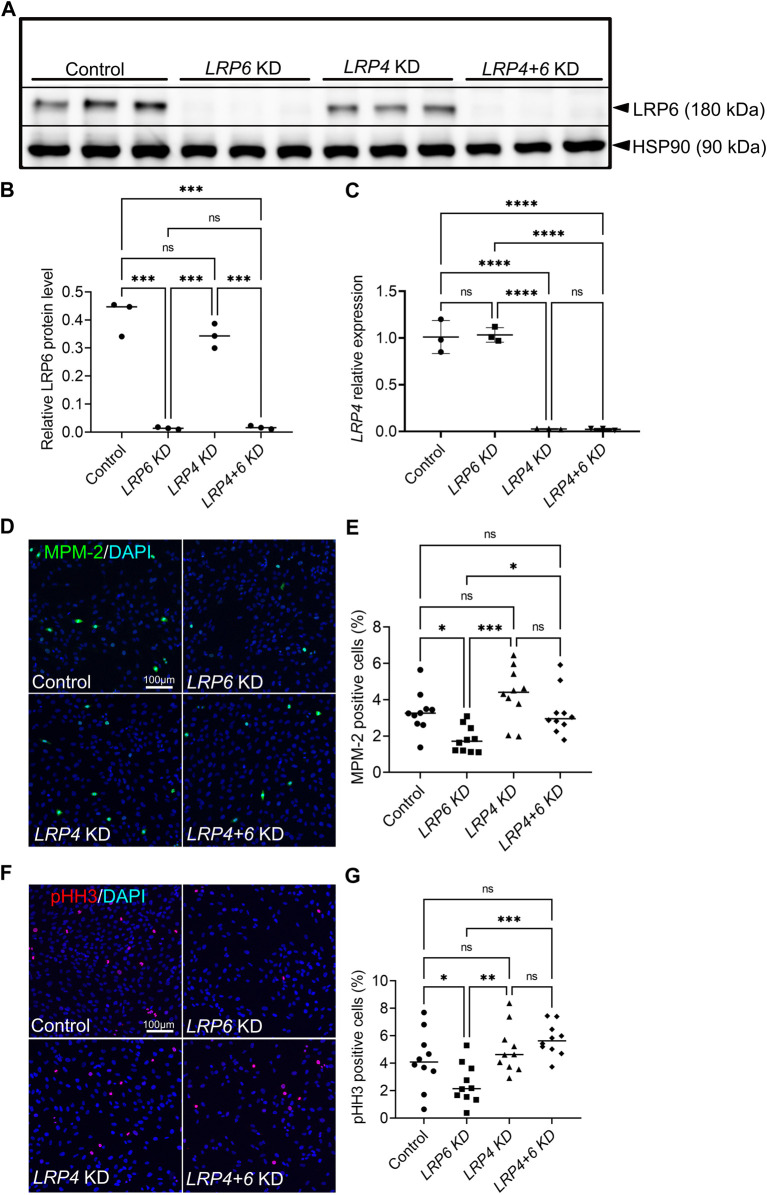
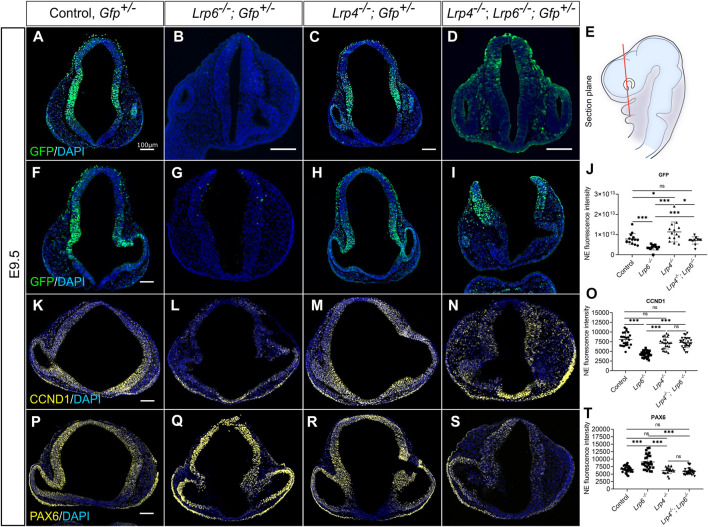
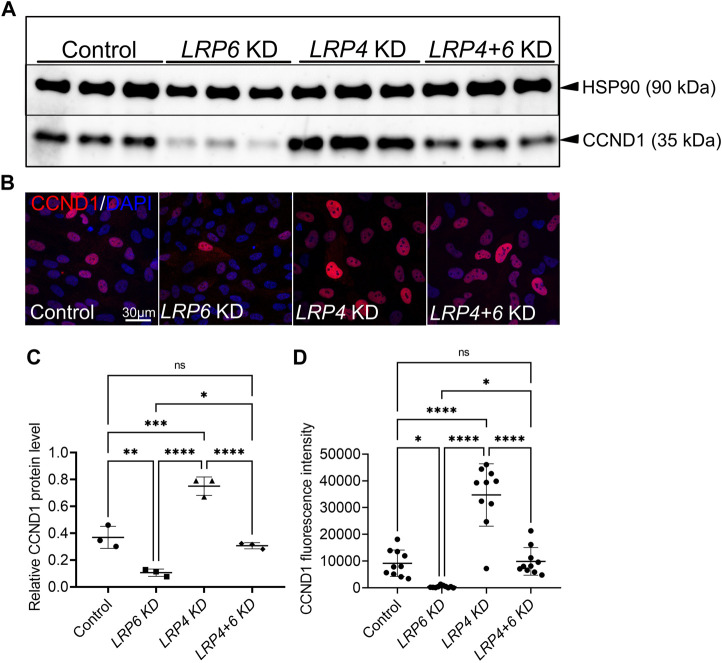
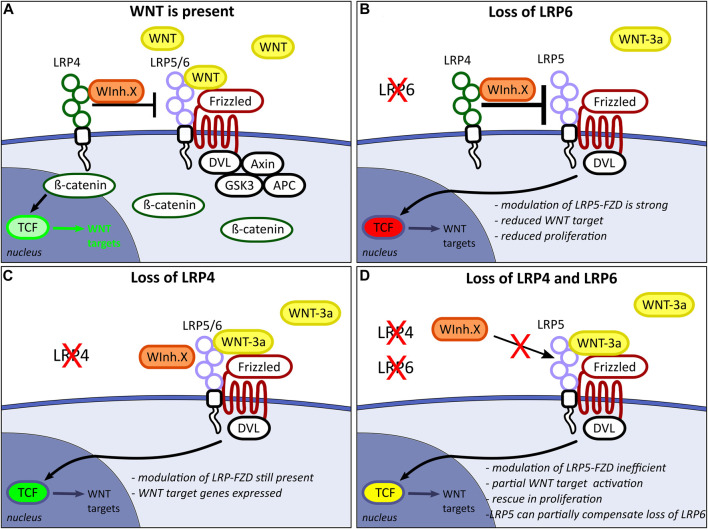
The specification of the forebrain relies on the precise regulation of WNT/ß-catenin signalling to support neuronal progenitor cell expansion, patterning, and morphogenesis. Imbalances in WNT signalling activity in the early neuroepithelium lead to congenital disorders, such as neural tube defects (NTDs). LDL receptor-related protein (LRP) family members, including the well-studied receptors LRP5 and LRP6, play critical roles in modulating WNT signalling capacity through tightly regulated interactions with their co-receptor Frizzled, WNT ligands, inhibitors and intracellular WNT pathway components. However, little is known about the function of LRP4 as a potential modulator of WNT signalling in the central nervous system. In this study, we investigated the role of LRP4 in the regulation of WNT signalling during early mouse forebrain development. Our results demonstrate that LRP4 can modulate LRP5- and LRP6-mediated WNT signalling in the developing forebrain prior to the onset of neurogenesis at embryonic stage 9.5 and is therefore essential for accurate neural tube morphogenesis. Specifically, LRP4 functions as a genetic modifier for impaired mitotic activity and forebrain hypoplasia, but not for NTDs in LRP6-deficient mutants. In vivo and in vitro data provide evidence that LRP4 is a key player in fine-tuning WNT signalling capacity and mitotic activity of mouse neuronal progenitors and of human retinal pigment epithelial (hTERT RPE-1) cells. Our data demonstrate the crucial roles of LRP4 and LRP6 in regulating WNT signalling and forebrain development and highlight the need to consider the interaction between different signalling pathways to understand the underlying mechanisms of disease. The findings have significant implications for our mechanistic understanding of how LRPs participate in controlling WNT signalling.

Keywords: LRP4; LRP6; WNT pathway; development; forebrain; genetic modifier; neuroepithelium; neuronal progenitor.


Conflict of interest statement

The authors declare that the research was conducted in the absence of any commercial or financial relationships that could be construed as a potential conflict of interest.

Figures

FIGURE 1
FIGURE 1
Distinct and overlapping expression of Lrp4 and Lrp5 mRNA in the early developing neural tube. (A–C) Schematics indicate planes of coronal sections of mouse embryonic forebrains, anterior to the optic cup, between embryonic stages E8.5 and E10.5. Images of further section planes are presented in Supplementary Figure S1. (D) Lrp4 mRNA expression could not be detected by whole mount in situ hybridization (ISH) at E8.5 (whole embryo at E8.5, lateral view, asterisk marks the head, dorsoventral- (d-v) and anteroposterior axis (a-p) are indicated, scale bar: 100μm, n = 4 embryos). (E) At E9.5 Lrp4 mRNA could be visualized by ISH on coronal sections of the forebrain. Lrp4 was expressed in the entire dorsal lateral domain of the neural tube including the dorsal midline, while the ventral midline was always void of Lrp4 transcripts (white arrowheads: ventral border of Lrp4 expression domain, scale bar: 100μm, n = 5 embryos). (F) At E10.5 Lrp4 continued to be expressed in the neuroepithelium showing ISH signals in the dorsolateral but not in the ventral domains of the forebrain (white arrowheads indicating the ventral border of Lrp4 expression, scale bar: 500μm, n = 5 embryos). (G–I) Schematics indicating the Lrp4 transcript distribution (red) on coronal forebrain sections between E8.5 and E10.5. (J) Lrp5 was already expressed at E8.5 in the neural folds. Whole mount ISH shows Lrp5 transcripts in the neural folds (whole embryo at E8.5, lateral view, asterisk marks the head, dorsoventral (d-v) and anteroposterior axis (a-p) are indicated, scale bar: 100μm, n = 4 embryos). (K) ISH on coronal sections at E9.5 indicate that Lrp5 is widely expressed in the neural tube (scale bar: 100μm, n = 3 embryos). (L) At E10.5, Lrp5 continued to be expressed in neuroepithelial cells of the entire neural tube. Little signals are seen in the dorsal midline (scale bar: 500μm, n = 4 embryos). (M–O) Schematics indicating Lrp5 transcript distribution (red) on coronal forebrain sections between E8.5 and E10.5.
FIGURE 2
FIGURE 2
Loss of both, LRP4 and LRP5, leads to impaired cranial neural tube closure. (A–C) At E9.0 and E9.5 (somite stages 20–25) all Lrp4 −/− single mutant mouse embryos (B) (n = 5), all Lrp5 −/− mutants (C) (n = 3) and all wild-type littermate controls (A) (n = 5) displayed a closed anterior neuropore (ANP). (D) In contrast, 88% of all Lrp4 −/− ; Lrp5 −/− double mutant embryos (8 out of 9) had an open anterior neuropore (frontal view of whole embryo heads, dotted yellow lines and arrowhead indicate the open ANP, scale bar: 500 µm); (D′) Schematic indicating the open anterior neuropore at E9.5 in black. (E–G) At E10.5 wild-type controls (E) (n = 3), Lrp4 −/− embryos (F) (n = 4), and Lrp5 −/− embryos (G) (n = 3) displayed normal cross morphology of the forebrain and the ANP was closed (frontal view of whole embryo heads). (H) 80% of the Lrp4 −/− ; Lrp5 −/− double mutant embryos showed an open anterior neuropore (dotted line and arrowhead) at E10.5 (4 out of 5 embryos). Scale bar: 500 μm. (H′) Schematic indicating the open anterior neuropore at E10.5 in black.
FIGURE 3
FIGURE 3
Genetic ablation of LRP4 function in rescues neuroepithelial hypoplasia but not cranial neural tube defects (NTDs) in Lrp6 −/− mutants. (A–H) Lateral views of whole embryos at E9.5. As reported before, the caudal truncation phenotype was fully penetrant in Lrp6 −/− mutants [(B, F), arrows]. 32% of Lrp6 −/− mutants (8 out of 25) displayed cranial NTDs [(F), arrowheads] compared to stage matched littermate wild-type controls (A, E) and 68% of Lrp6 −/− mutants (17 out of 25) had a closed cranial neural tube (B). Lrp4 −/− mutants (C, G) showed a cross morphology comparable to wild-type controls and never displayed NTDs. Lrp4 −/− ; Lrp6 −/− double mutants had a less severe caudal truncation (D, H), the cranial NTD however was seen in a similar frequency as in Lrp6 −/− mutants. 62.5% of the Lrp4 −/− ; Lrp6 −/− mutants (15 out of 24) had a closed anterior neural tube (D) whereas 37.5% (9 out of 24) Lrp4 −/− ; Lrp6 −/− mutants suffered from cranial NTDs (H). Scale bars: 300 µm. (I–L) Representative images of DAPI stained coronal sections with the bars indicating the thickness of the forebrain neuroepithelium at E9.5 measured along the dorsolateral domain indicated by the dotted line. Lrp6 −/− mutants (J) displayed in average a significantly thinner neuroepithelium compared to embryonic stage-matched wild-type controls (I) and Lrp4 −/− mutants (K), which had normal neuroepithelial morphology comparable to controls. Lrp4 −/− ; Lrp6 −/− double mutants (L) showed a rescue of neuroepithelium thickness compared to Lrp6 −/− single mutants and had a neuroepithelial morphology comparable to controls. Scale bar: 75 µm. (M) The graph shows individual points, representing the individual measurements of the forebrain neuroepithelium thickness. Three regions from the lateral domain, as indicated by the horizontal lines, were measured from each section. For each sample, 5 to 15 sections were examined; n = 4 embryos for controls, n = 3 Lrp6 −/− mutants, n = 3 Lrp4 −/− mutants, n = 4 Lrp4 −/− ; Lrp6 −/− double mutants; statistics: one-way ANOVA; NE: neuroepithelium.
FIGURE 4
FIGURE 4
Decreased mitotic activity in LRP6-deficient neuroepithelium is rescued by ablation of LRP4. (A–D) Immunostaining for the mitosis marker MPM-2 (marks all cell in M-Phase) to visualize and quantify mitotic cells within the neuroepithelium on E 9.5 coronal forebrain sections. MPM-2 positive cells were detected at the apical side of the neuroepithelium facing the ventricle [depicted in the schematic, (E)] in wild-type controls (A) and Lrp4 −/− embryos (C) in similar numbers. Lrp6 −/− forebrain neuroepithelium sections showed significantly lower numbers of mitotic cells (B) compared to wild-type controls and Lrp4 −/− single mutants. Lrp4 −/− ; Lrp6 −/− double mutants (D) had similar numbers of mitotic neuroepithelial cells as wild-type controls and therefore showed a clear rescue of mitotic activity compared to Lrp6 −/− single mutants. Scale bar: 200 μm. (F) To quantify mitotic cells within the neuroepithelium, neural progenitor cells that stained positive for mitosis marker MPM-2 were counted manually on six coronal sections of the forebrain for each embryo. Number of embryos for each genotype: controls n = 6, Lrp6 −/− n = 6, Lrp4 −/− n = 4; Lrp4 −/− ; Lrp6 −/− n = 5; The mean values of MPM-2 cell count for each section was calculated and correlated to DAPI counts. Statistics: one-way ANOVA; NE: neuroepithelium. NE: neuroepithelium.
FIGURE 5
FIGURE 5
LRP4 modulates of LRP6-dependent mitotic activity in human TERT RPE-1 cells. (A, B) Western blot analysis and quantification of LRP6 protein levels after Lrp6 siRNA and control siRNA treatment respectively, demonstrated significantly lower LRP6 protein levels in hTERT RPE-1 cells after LRP6 silencing and simultaneous LRP4 and LRP6 silencing compared to controls and compared to LRP4 silencing only. These results validate the LRP6 silencing and demonstrate that there is no up- or downregulation of LRP4 levels in Lrp6 siRNA treated cells. Quantification of LRP6 levels was normalized to HSP90 (heat shock protein 90) signals. Three independent experiments in triplicates (technical replicates) are summarized in the graph. Significance assessed by one-way ANOVA. **** p ≤ 0.0001; data are mean ± s.d. (C) LRP4 siRNA mediated silencing was validated by quantitative RT-RCR. Significantly lower LRP4 transcription was detected in hTERT RPE-1 cells after LRP4 silencing and simultaneous LRP4 and LRP6 silencing compared to controls and compared to LRP6 silencing only. The results demonstrate that there is no up- or downregulation of LRP6 mRNA levels in LRP4 siRNA treated cells. Three independent experiments in triplicates are summarized in the graph. Significance assessed by one-way ANOVA. p value: **** p ≤ 0.0001; data are mean ± s.d. (D–E) MPM-2 positive cells are detected in hTERT RPE-1 cultures by immunocytochemistry. MPM-2 stains the cytoplasm from early prophase through metaphase, anaphase and telophase1. LRP4 silencing resulted in similar numbers of mitotic cells compared to controls. Significantly less mitotic cells were counted in cultures treated with siRNA to silence LRP6 compared to control siRNA treated cultures or LRP4 siRNA treated cultures. This decrease caused by LRP6-depletion was rescued by simultaneous silencing of LRP4 and LRP6. Scale bar: 100 μm. (E) MPM-2 positive cell number quantification was normalized to DAPI positive cells. 10 images of 581 μm2 were measured in each well. Quantification of three independent experiments with triplicates are summarized in the graph. Significance assessed by one-way ANOVA. p values: * p < 0.05, ***p ≤ 0.001; data are mean ± s.d. (F–G) Detection of phospho-histone H3 (pHH3) by immunocytochemistry in the nuclei of cells during M-phase. Similar to the results obtained by quantification of MPM-2 positive cells, significantly less mitotic cells were counted in cultures treated with siRNA to silence LRP6 compared to control or LRP4 siRNA treated cultures. This decrease caused by LRP6-depletion was rescued by simultaneous silencing of LRP4 and LRP6. Scale bar: 100 μm. (G) pHH3 positive cell number quantification was normalized to DAPI positive cells. 10 images of 581 μm2 were measured in each well. Quantification of three independent experiments with triplicates are summarized in the graph. Significance assessed by one-way ANOVA. p values: * p < 0.05, ** p ≤ 0.01, ***p ≤ 0.001; data are mean ± s.d.; KD: siRNA mediated knockdown (silencing).
FIGURE 6
FIGURE 6
Genetic inactivation of LRP4 rescues impaired canonical WNT activity and downstream target gene expression in Lrp6 −/− mutants. (A–J) TCF/Lef:H2B-GFP transgenic mouse line was used to visualize and quantify WNT/ß-catenin-signalling in neuroepithelial cells of all Lrp genotypes and controls. Quantification of GFP immunohistochemistry signals were performed on coronal forebrain sections from E9.5 mouse embryos. (E) Section plane for representative images is indicated in the schematic. (A–D) Representative images show forebrain sections from E9.5 embryos with closed cranial neural tube for all genotypes. (F–I) Images show forebrain sections from E9.5 embryos with open cranial neural tube phenotype for Lrp6 −/− ; Gfp + mutants and Lrp4 −/− ; Lrp6 −/− ; Gfp + double mutants. Wild-type; Gfp + controls and Lrp4 −/− ; Gfp + embryos never showed neural tube defects. Immunohistochemistry images in (A, F) show the pattern and intensity of GFP signals in wild-type controls, which displayed WNT/ß-catenin activity in the dorsolateral domain of the forebrain neuroepithelium. In age-matched and plane-matched forebrain sections of Lrp4 −/− ; Gfp + embryos (C, H), a similar pattern and intensity as in wild-type; Gfp + controls were observed. In the neuroepithelium of Lrp6 −/− ; Gfp + forebrains (B, G) significantly less GFP signal intensity was detected compared to controls, indicating a decrease in canonical WNT signalling activity. Lrp4 −/− ; Lrp6 −/− ; Gfp + double mutants (D, I) showed GFP intensity levels that were significantly higher than in Lrp6 −/− ; Gfp + single mutants and similar to wild-type; Gfp + controls, suggesting a clear rescue of canonical WNT signalling activity upon depletion of LRP4 function in Lrp6 −/− mutants. The reduced WNT/ß-catenin activity in Lrp6 −/− ; Gfp + single mutants and the rescue of canonical WNT/ß-catenin activity in LRP6-deficient forebrains by genetic ablation of LRP4 was also observed regardless of whether the embryos had a closed neural tube (B, D) or displayed cranial NTDs (G, I). (J) Graph shows quantification of mean GFP signal fluorescence intensity, y axis: fluorescence intensity in the entire neuroepithelium (NE). A total of 4 - 6 coronal sections from each embryo were examined from E9.5 wild-type; Gfp + embryos (n = 3), Lrp6 −/− ; Gfp + mutants (n = 3), Lrp4 −/− ; Gfp + mutants (n = 3) and Lrp4 −/− ; Lrp6 −/− ; Gfp + double mutants (n = 3). Scatter plot presents mean ± s.d.; the significance was assessed with student t-test; p values: * p < 0.05, *** p < 0.001. NE: neuroepithelium. (K–N) Cyclin D1 (CCND1) is a known WNT/ß-catenin downstream target gene and a cell cycle regulator. Images show immunohistochemistry for Cyclin D1 on coronal forebrain sections. Lrp4 −/− ; Lrp6 −/− double mutants exhibited significantly stronger signals for Cyclin D1 in the neuroepithelium compared to Lrp6 −/− single mutants, which had dramatically reduced Cyclin D1 levels compared to controls. Lrp4 −/− single mutants displayed similar levels of Cyclin D1 as wild-type controls. (O) Graph shows quantification of Cyclin D1 immunohistochemistry signal intensity, y axis: mean fluorescence intensity in the entire neuroepithelium. Immunofluorescence intensity of Cyclin D1 measured in the neuroepithelium from E9.5 wild-type; Gfp + embryos (n = 3), Lrp6 −/− ; Gfp + mutants (n = 4), Lrp4 −/− ; Gfp + mutants (n = 3) and Lrp4 −/− ; Lrp6 −/− ; Gfp + double mutants (n = 3). A total of 7–12 coronal sections from each embryo were examined. Scatter plot presents mean ± s.d.; the significance was assessed with one-way ANOVA; p value: *** p < 0.001. (P–S) PAX6 is another downstream target of the WNT/ß-catenin pathway but in contrast to Cyclin D1 negatively regulated. Accordingly, Lrp6 −/− embryos showed stronger signals for PAX6 compared to wild types and compared to Lrp4 −/− mutants, which showed a normal pattern for PAX6 in the mediolateral anterior neural tube. Lrp4−/−; Lrp6−/− mutants showed PAX6 signal intensity and PAX6 pattern comparable to wild-type controls and therefore a rescue of impaired PAX6 protein levels in Lrp6−/− single mutants. (T) Graph shows quantification of PAX6 immunohistochemistry signal intensity, y axis: mean fluorescence intensity in the entire neuroepithelium. Immunofluorescence intensity of GFP measured in the neuroepithelium from E9.5 wild-type; Gfp + embryos (n = 3), Lrp6 −/− ; Gfp + mutants (n = 4), Lrp4 −/− ; Gfp + mutants (n = 3) and Lrp4 −/− ; Lrp6 −/− ; Gfp + double mutants (n = 3). A total of –15 coronal sections from each embryo were examined. Scatter plot presents mean ± s.d.; the significance was assessed with one-way ANOVA; p value: *** p < 0.001. Scale bars: 100 µm.
FIGURE 7
FIGURE 7
LRP4 modulates of LRP6-dependent Cyclin D1 levels in human TERT RPE-1 cells. (A, C) Western blot analysis and quantification of Cyclin D1 (CCND1) protein levels after Lrp6 siRNA and control siRNA treatment respectively, demonstrated significantly lower Cyclin D1 protein levels hTERT RPE-1 cells after LRP6 silencing. Significant upregulation of Cyclin D1 levels were observed in cultures where LRP4 was silenced compared to cultures treated with control siRNA. Simultaneous silencing of LRP4 and LRP6 showed Cyclin D1 levels comparable with controls and therefore a rescue of decreased Cylin D1 levels in cells with LRP6 silencing. Quantification of Cyclin D1 levels was normalized to HSP90 (heat shock protein 90) signals. Three independent experiments in triplicates are summarized in the graphs. Significance assessed by one-way ANOVA. p values: * p < 0.05, ** p ≤ 0.01, ***p ≤ 0.001, **** p ≤ 0.0001; data are mean ± s.d. (B, D) Cyclin D1 positive cells are detected in hTERT RPE-1 cultures by immunocytochemistry. LRP4 silencing resulted in higher levels of Cyclin D1 positive cells compared to controls. Significantly less Cyclin D1 positive cells were counted in cultures treated with siRNA to silence LRP6 compared to control siRNA treated cultures. This decrease in Cyclin D1 levels, caused by LRP6-depletion, was rescued by simultaneous silencing of LRP4 and LRP6. Scale bar = 30 μm. Cyclin D1 signal intensity quantification was normalized to DAPI positive cell counts. 10 images of 160 μm2 were measured in each well. Quantification of three independent experiments with triplicates are summarized in the graph. Significance assessed by one-way ANOVA. p values: * p < 0.05, **** p ≤ 0.0001; data are mean ± s.d.; KD: siRNA mediated knockdown (silencing).
FIGURE 8
FIGURE 8
Hypothetical model for WNT pathway modulation by the LRP-Frizzled (FZD) complex in the developing forebrain. (A) LRP4 acts as an inhibitor on the LRP5/6-FZD complex and limits LRP5/6 binding capacity for WNT ligands, which consequently modulates WNT downstream target expression. LRP4 might present a WNT inhibitor X (WInh.X) to the LRP5/6-FZD complex. Model adapted from Ahn and colleagues (Ahn et al., 2013). (B) The loss of LRP6 function in the presence of WNT pathway inhibition by LRP4 leads to insufficient compensation by LRP5. This results in impaired binding of WNT3a to the LRP5-FZD complex, thereby inducing a significant reduction in the expression of WNT target genes. (C) In absence of LRP4, WNT inhibitor X can still bind to the LRP-FZD receptor complex. Slightly increased WNT/ß-catenin activity does not lead to significantly altered WNT downstream gene expression. (D) In Lrp4 −/− ; Lrp6 −/− double mutants, LRP4 can no longer present WNT inhibitor X to the LRP-FZD complex. Binding of WInh.X to LRP5 is too weak to have an inhibiting effect on the WNT/ß-catenin pathway activation. LRP5 can partially compensate for loss of LRP6 only in the absence of the WNT pathway inhibitor LRP4.

Similar articles

Cited by

References

    1. Ahn V. E., Chu M. L.-H., Choi H.-J., Tran D., Abo A., Weis W. I. (2011). Structural basis of wnt signaling inhibition by dickkopf binding to LRP5/6. Dev. Cell 21, 862–873. 10.1016/j.devcel.2011.09.003 - DOI - PMC - PubMed
    1. Ahn Y., Sanderson B. W., Klein O. D., Krumlauf R. (2010). Inhibition of Wnt signaling by Wise (Sostdc1) and negative feedback from Shh controls tooth number and patterning. Dev. Camb. Engl. 137, 3221–3231. 10.1242/dev.054668 - DOI - PMC - PubMed
    1. Ahn Y., Sims C., Logue J. M., Weatherbee S. D., Krumlauf R. (2013). Lrp4 and Wise interplay controls the formation and patterning of mammary and other skin appendage placodes by modulating Wnt signaling. Dev. Camb. Engl. 140, 583–593. 10.1242/dev.085118 - DOI - PMC - PubMed
    1. Ahn Y., Sims C., Murray M. J., Kuhlmann P. K., Fuentes-Antrás J., Weatherbee S. D., et al. (2017). Multiple modes of Lrp4 function in modulation of Wnt/β-catenin signaling during tooth development. Dev. Camb. Engl. 144, 2824–2836. 10.1242/dev.150680 - DOI - PMC - PubMed
    1. Allache R., Lachance S., Guyot M. C., De Marco P., Merello E., Justice M. J., et al. (2014). Novel mutations in Lrp6 orthologs in mouse and human neural tube defects affect a highly dosage-sensitive Wnt non-canonical planar cell polarity pathway. Hum. Mol. Genet. 23, 1687–1699. 10.1093/hmg/ddt558 - DOI - PMC - PubMed

LinkOut - more resources