

An integrated bioinformatic analysis of bulk and single-cell sequencing clarifies immune microenvironment and metabolic profiles of lung adenocarcinoma to predict immunotherapy efficacy
- PMID: 37091977
- PMCID: PMC10113470
- DOI: 10.3389/fcell.2023.1163314
An integrated bioinformatic analysis of bulk and single-cell sequencing clarifies immune microenvironment and metabolic profiles of lung adenocarcinoma to predict immunotherapy efficacy
Abstract
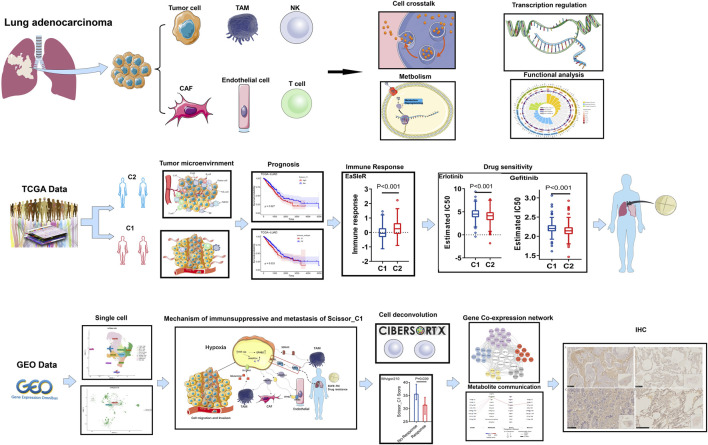
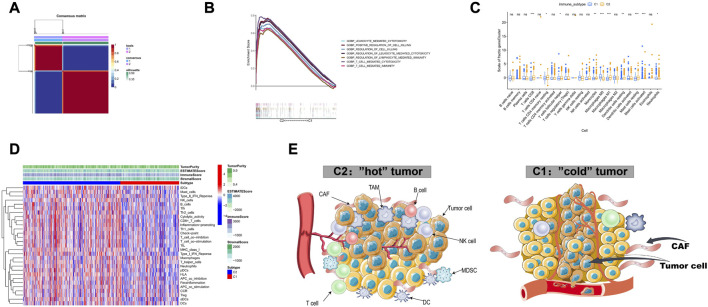
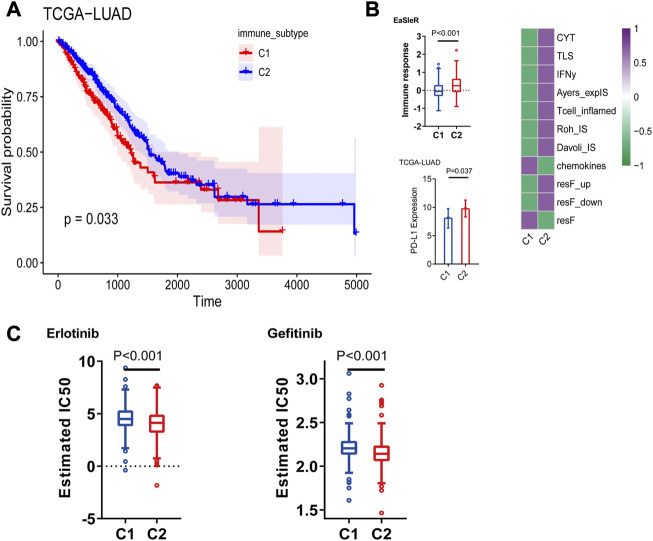
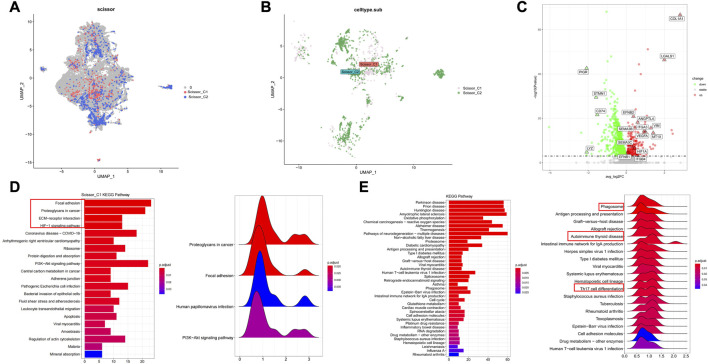
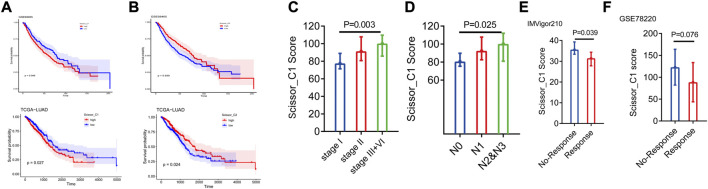
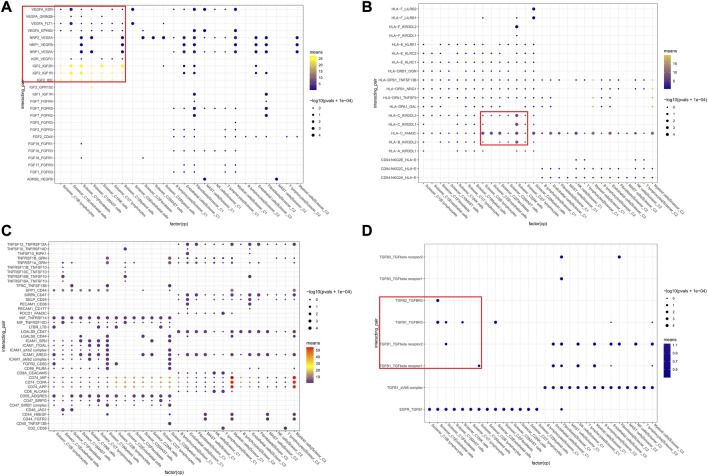
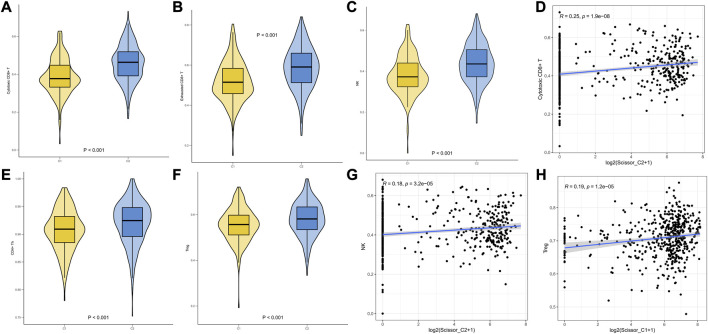
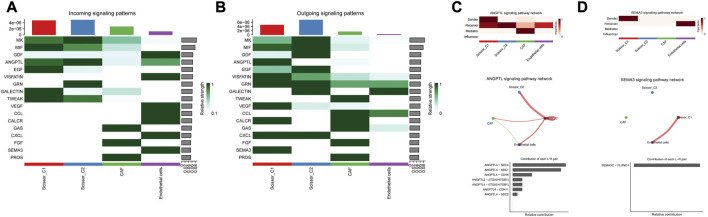
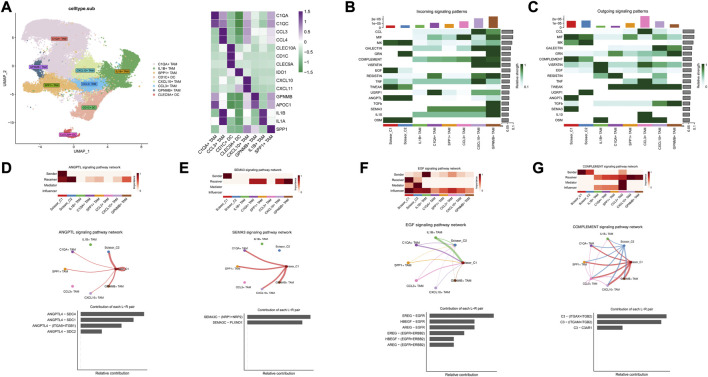
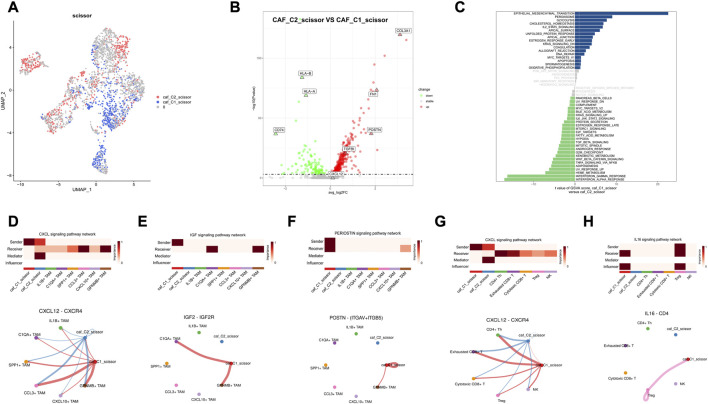
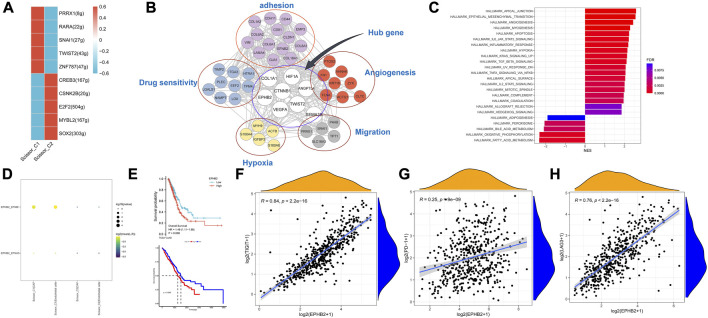
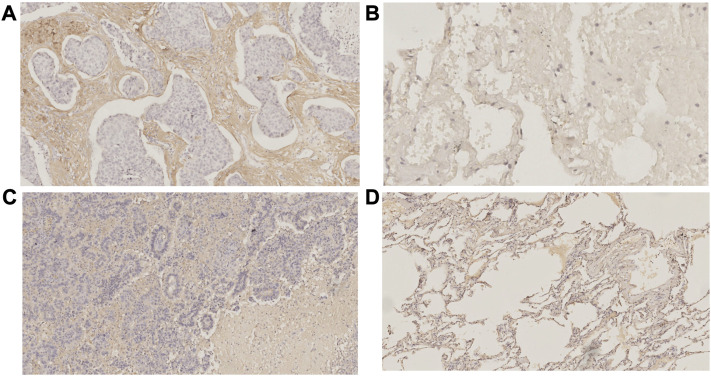
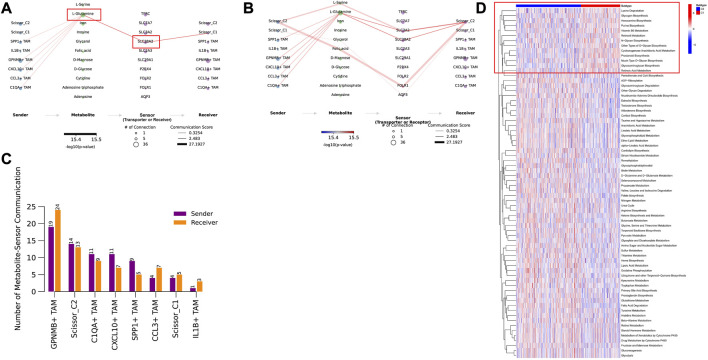
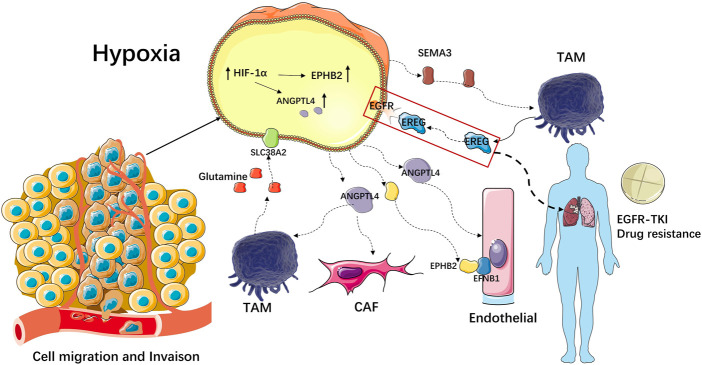
Targeting the tumor microenvironment is increasingly recognized as an effective treatment of advanced lung adenocarcinoma (LUAD). However, few studies have addressed the efficacy of immunotherapy for LUAD. Here, a novel method for predicting immunotherapy efficacy has been proposed, which combines single-cell and bulk sequencing to characterize the immune microenvironment and metabolic profile of LUAD. TCGA bulk dataset was used to cluster two immune subtypes: C1 with "cold" tumor characteristics and C2 with "hot" tumor characteristics, with different prognosis. The Scissor algorithm, which is based on these two immune subtypes, identified GSE131907 single cell dataset into two groups of epithelial cells, labeled as Scissor_C1 and Scissor_C2. The enrichment revealed that Scissor_C1 was characterized by hypoxia, and a hypoxic microenvironment is a potential inducing factor for tumor invasion, metastasis, and immune therapy non-response. Furthermore, single cell analysis was performed to investigate the molecular mechanism of hypoxic microenvironment-induced invasion, metastasis, and immune therapy non-response in LUAD. Notably, Scissor_C1 cells significantly interacted with T cells and cancer-associated fibroblasts (CAF), and exhibited epithelial-mesenchymal transition and immunosuppressive features. CellChat analysis revealed that a hypoxic microenvironment in Scissor_C1elevated TGFβ signaling and induced ANGPTL4 and SEMA3C secretion. Interaction with endothelial cells with ANGPTL4, which increases vascular permeability and achieves distant metastasis across the vascular endothelium. Additionally, interaction of tumor-associated macrophages (TAM) and Scissor_C1 via the EREG/EFGR pathway induces tyrosine kinase inhibitor drug-resistance in patients with LAUD. Thereafter, a subgroup of CAF cells that exhibited same features as those of Scissor_C1 that exert immunosuppressive functions in the tumor microenvironment were identified. Moreover, the key genes (EPHB2 and COL1A1) in the Scissor_C1 gene network were explored and their expressions were verified using immunohistochemistry. Finally, the metabolism dysfunction in cells crosstalk was determined, which is characterized by glutamine secretion by TAM and uptake by Scissor_C1 via SLC38A2 transporter, which may induce glutamine addiction in LUAD cells. Overall, single-cell sequencing clarifies how the tumor microenvironment affects immunotherapy efficacy via molecular mechanisms and biological processes, whereas bulk sequencing explains immunotherapy efficacy based on clinical information.
Keywords: cancer-associated fibroblasts; epithelia-mesenchymal transition; immunotherapy; lung adenocarcinoma; metabolism; single-cell multi-omics.
Copyright © 2023 Li, Zhou and Zheng.
Conflict of interest statement
The authors declare that the research was conducted in the absence of any commercial or financial relationships that could be construed as a potential conflict of interest.
Figures
Similar articles
-
Prediction of prognosis, immunogenicity and efficacy of immunotherapy based on glutamine metabolism in lung adenocarcinoma.Front Immunol. 2022 Aug 11;13:960738. doi: 10.3389/fimmu.2022.960738. eCollection 2022. Front Immunol. 2022. PMID: 36032135 Free PMC article.
-
Integrating bulk-RNA sequencing and single-cell sequencing analyses to characterize adenosine-enriched tumor microenvironment landscape and develop an adenosine-related prognostic signature predicting immunotherapy in lung adenocarcinoma.Funct Integr Genomics. 2024 Jan 24;24(1):19. doi: 10.1007/s10142-023-01281-z. Funct Integr Genomics. 2024. PMID: 38265702
-
Single-cell dissection reveals the role of aggrephagy patterns in tumor microenvironment components aiding predicting prognosis and immunotherapy on lung adenocarcinoma.Aging (Albany NY). 2023 Dec 13;15(23):14333-14371. doi: 10.18632/aging.205306. Epub 2023 Dec 13. Aging (Albany NY). 2023. PMID: 38095634 Free PMC article.
-
AMPK-a key factor in crosstalk between tumor cell energy metabolism and immune microenvironment?Cell Death Discov. 2024 May 18;10(1):237. doi: 10.1038/s41420-024-02011-5. Cell Death Discov. 2024. PMID: 38762523 Free PMC article. Review.
-
Unraveling the tumor immune microenvironment of lung adenocarcinoma using single-cell RNA sequencing.Ther Adv Med Oncol. 2024 Apr 10;16:17588359231210274. doi: 10.1177/17588359231210274. eCollection 2024. Ther Adv Med Oncol. 2024. PMID: 38606165 Free PMC article. Review.
Cited by
-
Unlocking the Microbial Symphony: The Interplay of Human Microbiota in Cancer Immunotherapy Response.Cancers (Basel). 2025 Feb 26;17(5):813. doi: 10.3390/cancers17050813. Cancers (Basel). 2025. PMID: 40075661 Free PMC article. Review.
-
Leveraging Single-Cell Multi-Omics to Decode Tumor Microenvironment Diversity and Therapeutic Resistance.Pharmaceuticals (Basel). 2025 Jan 10;18(1):75. doi: 10.3390/ph18010075. Pharmaceuticals (Basel). 2025. PMID: 39861138 Free PMC article. Review.
-
Tumor battlefield within inflamed, excluded or desert immune phenotypes: the mechanisms and strategies.Exp Hematol Oncol. 2024 Aug 6;13(1):80. doi: 10.1186/s40164-024-00543-1. Exp Hematol Oncol. 2024. PMID: 39107856 Free PMC article. Review.
-
Molecular subgroup establishment and signature creation of lncRNAs associated with acetylation in lung adenocarcinoma.Aging (Albany NY). 2024 Jan 17;16(2):1276-1297. doi: 10.18632/aging.205407. Epub 2024 Jan 17. Aging (Albany NY). 2024. PMID: 38240708 Free PMC article.
-
Hidden forces: the impact of cancer-associated fibroblasts on non-small cell lung cancer development and therapy.J Transl Med. 2025 Jul 25;23(1):830. doi: 10.1186/s12967-025-06791-x. J Transl Med. 2025. PMID: 40713753 Free PMC article. Review.
References
LinkOut - more resources
Full Text Sources
Miscellaneous