Review
. 2023 Apr 6:11:1151348.
doi: 10.3389/fcell.2023.1151348. eCollection 2023.

Patterning of the Drosophila retina by the morphogenetic furrow

Affiliations
Review

Patterning of the Drosophila retina by the morphogenetic furrow

Jasmine Warren et al. Front Cell Dev Biol. .

Abstract

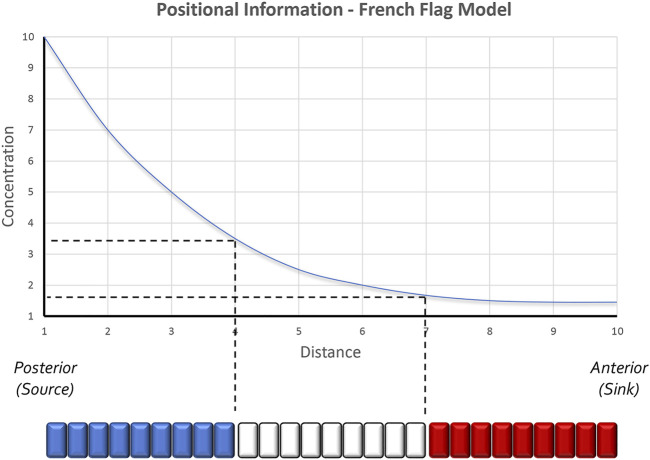
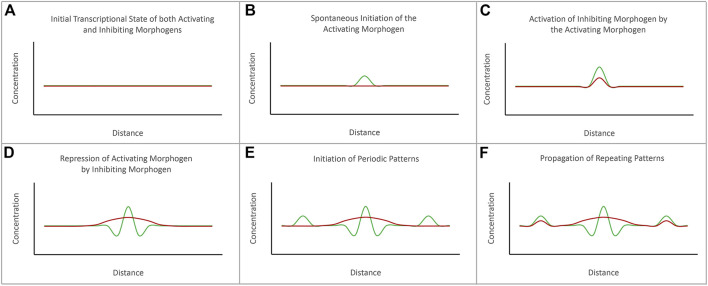
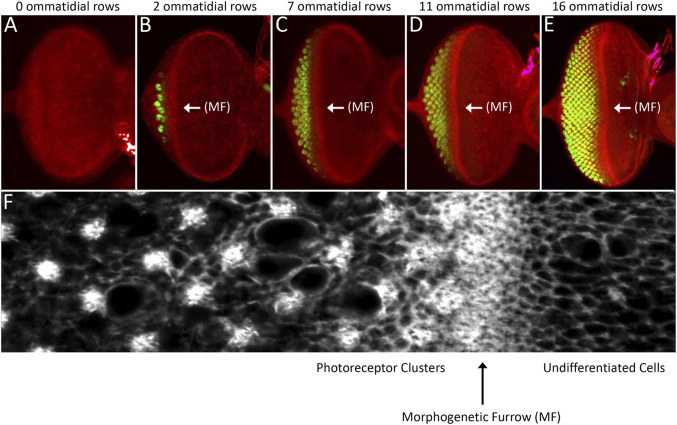
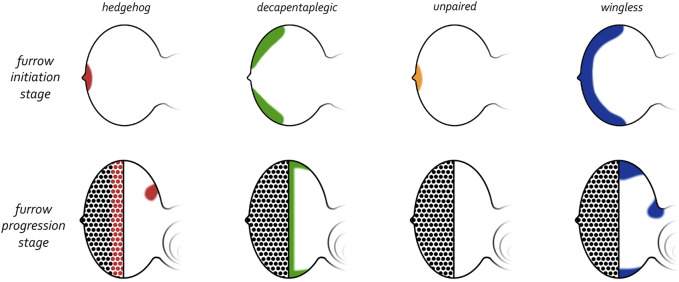
Pattern formation is the process by which cells within a homogeneous epithelial sheet acquire distinctive fates depending upon their relative spatial position to each other. Several proposals, starting with Alan Turing's diffusion-reaction model, have been put forth over the last 70 years to describe how periodic patterns like those of vertebrate somites and skin hairs, mammalian molars, fish scales, and avian feather buds emerge during development. One of the best experimental systems for testing said models and identifying the gene regulatory networks that control pattern formation is the compound eye of the fruit fly, Drosophila melanogaster. Its cellular morphogenesis has been extensively studied for more than a century and hundreds of mutants that affect its development have been isolated. In this review we will focus on the morphogenetic furrow, a wave of differentiation that takes an initially homogeneous sheet of cells and converts it into an ordered array of unit eyes or ommatidia. Since the discovery of the furrow in 1976, positive and negative acting morphogens have been thought to be solely responsible for propagating the movement of the furrow across a motionless field of cells. However, a recent study has challenged this model and instead proposed that mechanical driven cell flow also contributes to retinal pattern formation. We will discuss both models and their impact on patterning.

Keywords: Drosophila; cell flow; diffusion-reaction; eye; morphogen; morphogenetic furrow; pattern formation; positional information.


Conflict of interest statement

The authors declare that the research was conducted in the absence of any commercial or financial relationships that could be construed as a potential conflict of interest.

Figures

FIGURE 1
FIGURE 1
The positional information model of pattern formation. Based in part by the results of transplantation experiments conducted within the chick limb bud by John Saunders, Lewis Wolpert proposed that secreted morphogens form smooth gradients across developing tissues. Groups of cells along the gradient then capture unique amounts of the morphogen and as a result produce distinct structures. Colorized representations of this model are often represented as a French Flag where each color of the flag represents the conversion of a distinct morphogen concentration into a unique physical structure. Studies in the Drosophila embryo have further suggested that even 2 cells lying adjacent to each other can sense very small differences in morphogen concentrations and as a result execute different developmental programs. The schematic is adapted from Sharpe and Greene, 2015.
FIGURE 2
FIGURE 2
The diffusion-reaction model for the de novo initiation of repeated patterns. Alan Turing proposed that repeated patterns could spontaneously be generated via the combined activities of activating and inhibiting morphogens. (A) Prior to the initiation of pattern formation, the expression levels of both activating and inhibiting morphogens are at baseline levels. (B) The initiation of a pattern begins with the spontaneous initiation of expression of the activating morphogen. (C) As levels of the activating morphogen rises, it activates expression of the inhibiting morphogen. (D) The expression levels of the activating morphogen are higher than the inhibiting morphogen at the source. However, the inhibiting morphogen can diffuse further than the activating morphogen. (E) The inhibiting morphogen suppresses the expression of the activating morphogen further away from the source. However, just beyond the range of the inhibiting morphogen is seen spontaneous activation of the activating morphogens. (F) The process repeats itself to generate a periodically spaced pattern of repeated elements. The schematic is adapted from Sharpe and Green, 2015.
FIGURE 3
FIGURE 3
The neighborhood watch model for understanding how cells understand their position within a concentration gradient. Claudio Stern has recently proposed that a cell cannot interpret the absolute value of the morphogen it captures. Instead, it compares itself with its neighbors to make a relative calculation as to the amount of morphogen it has received. The schematic was adapted from Lee et al., 2022.
FIGURE 4
FIGURE 4
A clock and wavefront model for the generation of vertebrate somites. This model, developed by Johnathan Cooke and Erick Christopher Zeeman, proposed a two-component mechanism that would account for the periodic emergence of vertebrate somites. At its core it proposes that a wavefront of maturation (i.e., gene expression) transforms populations of undifferentiated cells into a pair of somites at periodic intervals. These periodic waves are triggered by an internal oscillator within the pre-somitic mesoderm (clock). Initially, it was thought that a similar internal oscillator could participate in the production of column of ommatidia within the fly eye. The variable rate at which these columns are now known to be produced suggests that an internal clock does not exist within the fly eye imaginal disc.
FIGURE 5
FIGURE 5
Structure of the adult Drosophila compound eye. (A) A scanning electron micrograph of the adult compound eye reveals that it consists of approximately 750 unit eyes or ommatidia that are organized into 32–34 columns. (B) A light microscope section of the adult retina shows that the eight photoreceptors that are contained within each unit eye are organized into an asymmetrical trapezoid pattern. The only difference between one unit eye and another is the chirality of the trapezoid within ommatidia. (C) A schematic showing the distinct chiral patterns of ommatidia within the dorsal and ventral compartments. These two compartments meet at the center of the eye which is called the equator.
FIGURE 6
FIGURE 6
The Drosophila compound eye is a model system for identifying genes involved in development. Mutations that affect tissue specification, growth and proliferation, pattern formation, and cell fate specification can be identified by alterations in the crystalline-like nature of the adult compound eye. These mutant phenotypes can manifest themselves as (A) the absence of eyes, (B) small eyes, (C) large-roughened eyes, and (D) large-glazed looking eyes.
FIGURE 7
FIGURE 7
The eye-antennal disc gives rise to the adult head. (A) A light microscope image of a third larval instar eye-antennal disc. The disc is divided into several different neighborhoods that each give rise to a unique structure on the adult head. Each larva has two eye-antennal discs that are stitched together during pupal development. (B) A scanning electron micrograph of that adult head. The adult structures that are derived from the disc are labeled. oc, ocelli; ant, antenna; eye, compound eye; he, head epidermis; mp, maxillary palp.
FIGURE 8
FIGURE 8
Structure of the eye-antennal disc. The eye-antennal disc is comprised of three different cell types. A layer of columnar cells comprises the disc proper while an overlying layer of squamous cells makes up the peripodial epithelium. These two equally sized tissues are joined together at the edges by a strip of cuboidal cells referred to as the margin. (A, B) Schematics showing the relationship between the disc proper and the peripodial epithelium. (C) Cross-section view of the eye-antennal disc showing the relative position of all three layers and the enclosed lumen. It also shows the cellular composition of the three cellular layers.
FIGURE 9
FIGURE 9
The morphogenetic furrow patterns the eye field during the third larval instar. (A–E) Light microscope images of different stage third larval instar eye discs showing the progression of the morphogenetic furrow. As the furrow passes across the epithelium, columns of photoreceptor clusters (ELAV, green) are produced in its wake. (C) High magnification view of the area surrounding the morphogenetic furrow. Cells ahead the furrow have large apical profiles and are dividing randomly. As the furrow approaches, cells constrict their apical profiles and enter G1 arrest. As cells exit the furrow groups of periodically spaced cells exist the cell cycle and form the first five photoreceptors of each unit eyes. Cells between these developing ommatidia will eventually undergo one final round of mitosis and give rise to the final three photoreceptor neuron and twelve non-neuronal accessory cells. (F) A high magnification image showing a region around the morphogenetic furrow.
FIGURE 10
FIGURE 10
The retinal determination network specifies the fate of the eye. (A) The core members of the retinal determination network include the transcription factors Eyeless (Ey), Twin of Eyeless (Toy), Sine Oculis (So), Eyes Absent (Eya), and Dachshund (Dac). (B–D) Scanning electron micrographs of wild type (B) and eyeless loss-of-function mutants (C, D). Disruptions to the retinal determination network result in either the loss or the severe reduction of the compound eye. (E) Forced expression of members of the retinal determination network can induce the transdetermination of non-ocular tissues such as legs, wings, halteres, antennae, and genitalia into eyes.
FIGURE 11
FIGURE 11
Expression patterns of morphogens that regulate patterning of the eye. (Top row) Early third larval instar just prior to the initiation of the morphogenetic furrow. Prior to the initiation of the furrow, hedgehog and unpaired are expressed at the firing point while decapentaplegic and wingless are along the posterior-lateral margins. (Bottom row) Mid third larval instar in which the morphogenetic furrow has progressed half-way across the eye field. As the furrow progresses across the eye field, the expression patterns of all four morphogens are altered dramatically. Hedgehog is expressed within the first few columns of photoreceptor clusters, decapentaplegic is expressed within cells of the furrow, and wingless is expressed ahead of the furrow along the posterior margins. Both hedgehog and wingless are also expressed within the developing ocellar field.
FIGURE 12
FIGURE 12
Refinement of the atonal expression pattern. Atonal is first activated in a broad stripe ahead and within the morphogenetic furrow. As development proceeds, this broad pattern is reduced to a column of single cells through a series of refinement steps. During the first step groups of 10–15 cells (called intermediate groups) retain atonal expression. In the second step, atonal expression within the intermediate groups will be eliminated from all but two to three cells—These are now called equivalence groups. In the last step, a single cell within the equivalence group will retain atonal expression. This cell, the R8 photoreceptor, is the founding cell of the ommatidium.
FIGURE 13
FIGURE 13
The EGF receptor pathway maintains spacing between developing ommatidial clusters. Once the R8 cell is specified the EGFR pathway is then reiteratively used to specify the remaining photoreceptor neurons (purple circles). Starting with the R8 cell, each photoreceptor secretes the Spitz ligand. This activating morphogen is expressed at high levels but only travels short distances. The photoreceptor cells also secrete the Argos inhibiting morphogen. It is expressed at lower levels than Spitz but travels farther. The differences in levels and distance travelled by the two morphogens ensures that the unit eyes are spaced at periodic intervals. This is reminiscent of the diffusion-reaction model that was proposed by Alan Turing.

Similar articles

Cited by

References

    1. Abaturova M. P., Ginter E. K. (1968). The transplantation of the imaginal discs of the mutation ophtalmopedia in Drosophila melanogaster . Genetika 4, 58–64.
    1. Ahn S., Joyner A. L. (2004). Dynamic changes in the response of cells to positive hedgehog signaling during mouse limb patterning. Cell. 118, 505–516. 10.1016/j.cell.2004.07.023 - DOI - PubMed
    1. Alvarado D., Evans T. A., Sharma R., Lemmon M. A., Duffy J. B. (2006). Argos mutants define an affinity threshold for spitz inhibition in vivo . J. Biol. Chem. 281, 28993–29001. 10.1074/jbc.M603782200 - DOI - PubMed
    1. Atkins M., Mardon G. (2009). Signaling in the third dimension: The peripodial epithelium in eye disc development. Dev. Dyn. 238, 2139–2148. 10.1002/dvdy.22034 - DOI - PMC - PubMed
    1. Auerbach C. (1936). The development of the legs, wings, and halteres in wild type and some mutant strains of Drosophila melanogaster . Trans. R. Soc. Edin. LVIII. Part III, No. 27.

LinkOut - more resources