Review
. 2023 Apr 15;18(1):63.
doi: 10.1186/s11671-023-03814-8. eCollection 2023 Dec.

Advances in terahertz metasurface graphene for biosensing and application

Affiliations
Review

Advances in terahertz metasurface graphene for biosensing and application

Hao Bi et al. Discov Nano. .

Abstract

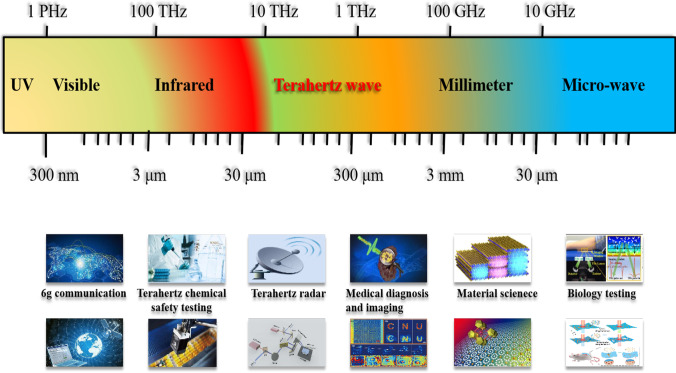
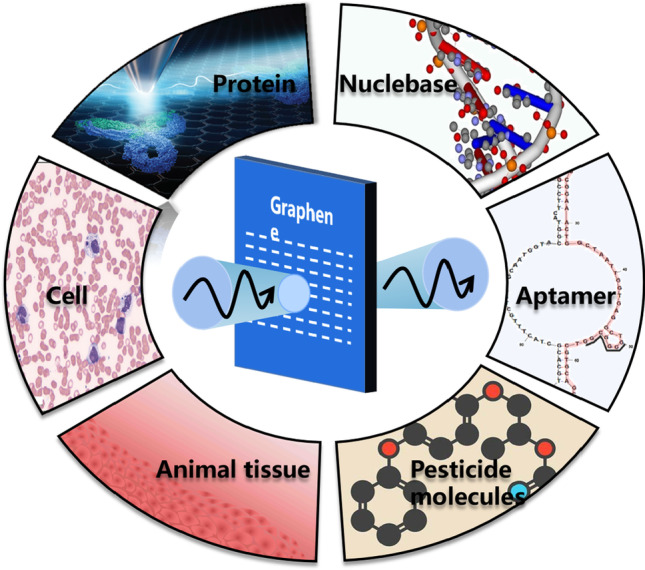
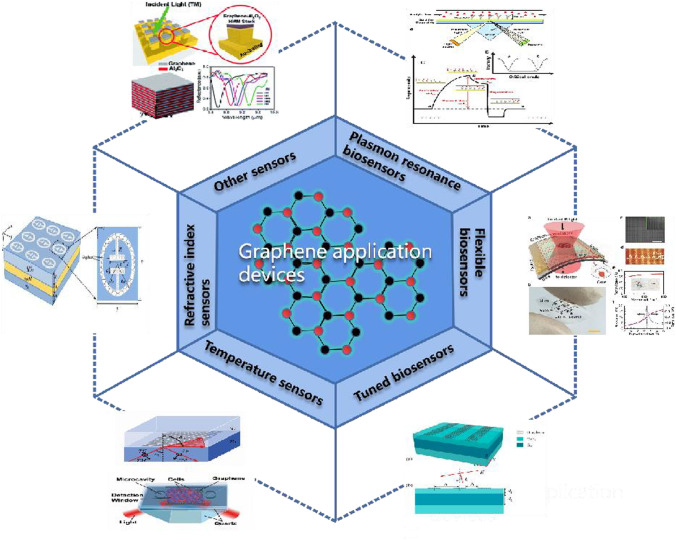
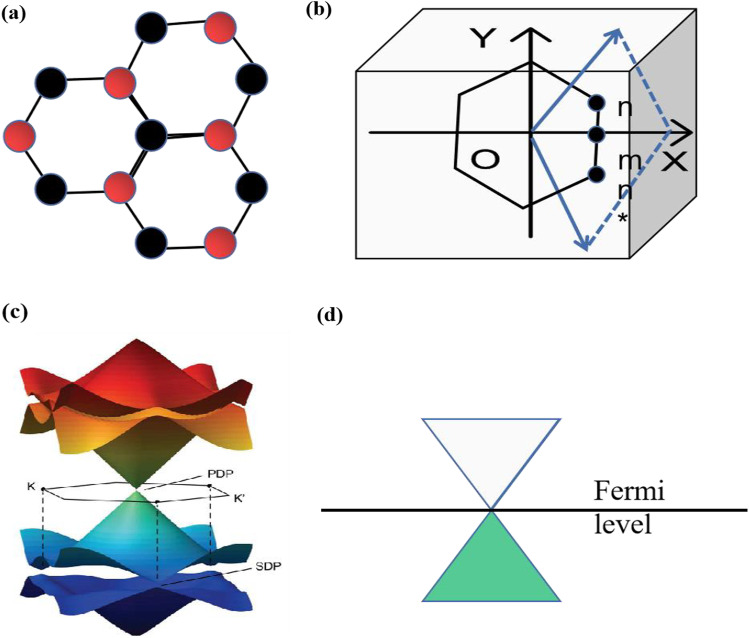
Based on the extraordinary electromagnetic properties of terahertz waves, such as broadband, low energy, high permeability, and biometric fingerprint spectra, terahertz sensors show great application prospects in the biochemical field. However, the sensitivity of terahertz sensing technology is increasingly required by modern sensing demands. With the development of terahertz technology and functional materials, graphene-based terahertz metasurface sensors with the advantages of high sensitivity, fingerprint identification, nondestructive and anti-interference are gradually gaining attention. In addition to providing ideas for terahertz biosensors, these devices have attracted in-depth research and development by scientists. An overview of graphene-based terahertz metasurfaces and their applications in the detection of biochemical molecules is presented. This includes sensor mechanism research, graphene metasurface index evaluation, protein and nucleic acid sensors, and other chemical molecule sensing. A comparative analysis of graphene, nanomaterials, silicon, and metals to develop material-integrated metasurfaces. Furthermore, a brief summary of the main performance results of this class of devices is presented, along with suggestions for improvements to the existing shortcoming.

Keywords: Biosensing; Graphene; Metasurfaces; Terahertz.


Conflict of interest statement

Competing interestsThe authors declare that they have no known competing financial interests or personal relationships that could have appeared to influence the work reported in this paper.

Figures

Fig. 1
Fig. 1
Schematic of the application of terahertz technology in related fields
Fig. 2
Fig. 2
Schematic of biochemical application of terahertz spectroscopy
Fig. 3
Fig. 3
Graphene metamaterials for sensing applications
Fig. 4
Fig. 4
a Hexagonal lattice structure of graphene, b Brillouin zone, c intrinsic graphene band mechanism, and d free-stand graphene [58]. copyright 2017, Carbon
Fig. 5
Fig. 5
Schematic diagram of the principle of terahertz metasurface sensor
Fig. 6
Fig. 6
a Schematic diagram of the proposed biosensor based on Fano resonance, b Effective refractive indices of graphene SPP and PWG modes, c Shift of Fano line shape for the structure with d1 = 7 μm, d2 = 70 μm, Ep = 0.35 eV, d Schematic diagram of the electric field distributions for the proposed Fano resonance sensor at θ = 33.1332°. [81] copyright 2017, Sensor
Fig. 7
Fig. 7
Schematic diagram of the proposed terahertz sensor a where the graphene is coated on the sensing medium and fastened by a fixing device, while a one-dimensional photonic crystal is beneath the sensing medium. b a) The normalized electric field distributions in the proposed structure in the absence of monolayer graphene. b) The normalized electric field distributions in the proposed structure coated with monolayer graphene. [83] Copyright 2020, Nanomaterials
Fig. 8
Fig. 8
a Arrangement of the proposed structure and applying the external gate voltage VG. b Absorption spectra vs. the changes of the RI of the analyte. [84] Copyright 2022, Plasmonics
Fig. 9
Fig. 9
Terahertz metal–graphene hybrid metamaterial. a Schematic diagram of THz metal–graphene hybrid. b Image of the metamaterial sitting on PET substrate. c Zoom-in view of the cu grating structure. d Raman spectrum of the transferred monolayer graphene. e Experimental transmission spectra of the metamaterials with/with graphene. [89] Copyright 2022, Sensors and Actuators B: Chemical
Fig. 10
Fig. 10
a Schematic illustration of metal–graphene hybrid metamaterial with Aβ16–22 peptides. b Experimentally measured THz transmission spectra of metamaterials without/with Aβ16–22 in different aggregation phases. ce AFM images and fg heights of Aβ16–22 aggregates in lag, elongation, and steady phases, respectively [89] Copyright 2022, Sensors and Actuators B: Chemical
Fig. 11
Fig. 11
Fabrication and mechanistic analysis of PGP@EMS biosensor; Manufacture of the PGP@EMS biosensor. a Manufacturing process: ① A PI film was spin-coated on a quartz substrate; ② preparation of EIT-like metasurface on the PI film; ③ PI film was spin-coated on the metasurface; ④ graphene was transferred onto the PI film; ⑤ trilayer graphene was patterned into stripes; ⑥ by soaking the sample in hydrofluoric acid, a flexible-based THz biosensor was obtained. b Qualitative sensing of plant protein. c Optical microscope images of the samples. d The unit cell of the EIT-like metasurface. The corresponding parameters were: p = 70 µm, c = 8 µm, w = 6 µm, r = 10 µm, f = 40 µm, and r = 24 µm. e Raman spectrum of graphene. f y-polarized transmission curve with analyte refractive index increasing from 1.0 to 2.0 and Fermi level of graphene simultaneously increasing from 0.1 to 0.4. g y-polarized frequency shift at f3 for different refractive indices of analyte and different Fermi levels of graphene, extracted from (hj) Change of Fermi level with patterned graphene mechanisms in the presence of plant protein. [19] Copyright 2022, Results in Physics
Fig. 12
Fig. 12
af Graphene-based biosensor with circular and split-ring resonator metasurface, and gj absorption response of graphene-based biosensor circular metasurface and split-ring resonator metasurface. [90] Copyright 2022, Physica B: Condensed Matter
Fig. 13
Fig. 13
DNA adsorption on the graphene-combined nano-slot metamaterial. a The THz sensing concept is used in this study and the black circle denotes absorption cross section, σ, with and without absorption enhancement which is proportional to Ex/Hy. b Change in THz transmission spectra due to ssDNA on Si, a bare nano-slot metamaterial, graphene-covered Si. c Summary of the change in transmittance for the four sensing platforms, and graphene-covered nano-slot metamaterial, respectively. d The spectra are normalized to the transmittance for bare Si and maximum transmittance at the resonance frequency of the nano-slot metamaterial (1.0 THz). [19] Copyright 2020, Sensors and Actuators B: Chemical
Fig. 14
Fig. 14
Sensing principle of graphene sensor operating in the THz regime. [95] Copyright 2020, ACS Applied Materials & Interfaces
Fig. 15
Fig. 15
Sensing chlorpyrifos-methyl using graphene sensor. a, Schematic of a graphene sensor for reflective sensing of chlorpyrifos-methyl. b, Experimental absorption curves for the graphene sensor with/without chlorpyrifos-methyl (CM is short for chlorpyrifos-methyl). The concentration of chlorpyrifos-methyl was 0.50 mg/L. c, Absorbance changes when chlorpyrifos-methyl molecules are adsorbed at concentrations from 0.01 to 0.50 mg/L. d, PLS regression result of chlorpyrifos-methyl molecules at concentrations from 0.02 to 0.50 mg/L. [95] Copyright 2020, ACS Applied Materials & Interfaces
Fig. 16
Fig. 16
Schematic a description of THz metamaterial biosensor for miRNA detection, b Sensitivity of THz metamaterial biosensor for miRNA-21 detection. The inset graph shows the linear relationship between Δf and the logarithm of miRNA-21 concentration. Error bars indicate the SD (n = 3). c Electric field distribution at the resonant frequency. Error bars indicate the SD (n = 3). d Sensitivity of THz metamaterial biosensor for miRNA-21 detection. The inset graph shows the linear relationship between Δf and the logarithm of miRNA-21 concentration. Error bars indicate the SD (n = 3). [96] Copyright 2021, Biosens Bioelectron
Fig. 17
Fig. 17
The CASR-graphene-based THz microfluidics platform. a Schematic drawing showing the working principle and design of DNA biosensing based on the proposed CASR-graphene THz microfluidic cell; b Schematic diagram of the manufacturing flow for the CASR-graphene THz microfluidic cell. c Schematic illustration of the position of the Dirac point and the Fermi level as a function of chemical doping. d Measured THz transmission spectra of DCH aqueous solutions at different concentrations. e Relative change rate in effective transmission areas of the four types of TMFCs for DCH aqueous solution detection versus DCH concentrations. The inset is an enlarged view of the relative change rate in effective transmission areas. [69] Copyright 2021, Biosens Bioelectron
Fig. 18
Fig. 18
Detection of various cancer with their normal cell for proposed sensor. a 3D view, b front view, c overhead view of metasurface senor design with no gap, d overhead view of metasurface senor design with gaps at the outer boundary, e overhead view of metasurface senor design with gaps at inner boundary, f overhead view of metasurface senor design with gaps at both outer and inner boundary. g and h Cancer cell detection performance and linearity. [98] Copyright 2022, Diamond and Related Materials
Fig. 19
Fig. 19
a Designed reflective graphene metasurface to detect metal ions HMI detection based on GTM, transmission-type, and refection-type structures. b Amplitude difference c phase difference peak graphene transmission coefficient graphene transmission fermi energy resonance peak changes, e electric field distribution at the transmission resonance peak. [99] Copyright 2021, Optical Materials Express
Fig. 20
Fig. 20
Schematic of said hybrid structure, a schematic diagram of the cells of said structure, c Transmission spectra of various hybridized structures, b Graphene surface current distribution and magnetic field distribution. [100] Copyright 2015, Plasmonics
Fig. 21
Fig. 21
ac Schematic representation of the functionalization steps for obtaining PA-VS surfaces. d Thickness and e contact angle evolution after different functionalization steps: PA anchoring on rGO/PBSE surfaces; changes after DVS functionalization (DVS); mannosylation (Mannose). Error bars represent the 95% confidence interval. f Raman spectra of DVS, PEI (750 kDa), and the product of the reaction between them in aqueous solution (PEI-DVS). [101] Copyright 2021 ACS Applied Materials & Interfaces

Similar articles

Cited by

References

    1. Wolfson AR, Mancini CM, Banerji A, Fu X, Bryant AS, Phadke NA, Shenoy ES, Arman W, Zhang Y, Blumenthal KG. Penicillin allergy assessment in pregnancy: safety and impact on antibiotic use. J Allergy Clin Immunol Pract. 2021;9:1338–1346. doi: 10.1016/j.jaip.2020.10.063. - DOI - PMC - PubMed
    1. Meng D, Liu J, Chen W, Cheng Y-Y, You K-W, Fan Z-C, Ye Q, Huang P-H, Chen Y-S. Study on the enhancement mechanism of terahertz molecular fingerprint sensing. Results Phys. 2022;39:105766. doi: 10.1016/j.rinp.2022.105766. - DOI
    1. Cao Y, Cheng Z, Wang R, Liu X, Zhang T, Fan F, Huang Y. Multifunctional graphene/carbon fiber aerogels toward compatible electromagnetic wave absorption and shielding in gigahertz and terahertz bands with optimized radar cross section. Carbon. 2022;199:333–346. doi: 10.1016/j.carbon.2022.07.077. - DOI
    1. Hao X, Li J, Zheng C, Li J, Yue Z, Tang X, Tan Q, Zhang Y, Yao J. Optically tunable extrinsic chirality of single-layer metal metasurface for terahertz wave. Opt Commun. 2022;512:127554. doi: 10.1016/j.optcom.2021.127554. - DOI
    1. Chen T, Tang Z, Hu C. The combination of terahertz spectroscopy and density functional theory for vibrational modes and weak interactions analysis of vanillin derivatives. J Mol Struct. 2022;1265:133404. doi: 10.1016/j.molstruc.2022.133404. - DOI

LinkOut - more resources