

CD8A is a Promising Biomarker Associated with Immunocytes Infiltration in Hyperoxia-Induced Bronchopulmonary Dysplasia
- PMID: 37092130
- PMCID: PMC10120826
- DOI: 10.2147/JIR.S397491
CD8A is a Promising Biomarker Associated with Immunocytes Infiltration in Hyperoxia-Induced Bronchopulmonary Dysplasia
Abstract
Background: Bronchopulmonary dysplasia (BPD) refers to a chronic lung disease which is commonly observed in preterm infants. It can usually be caused by several pathological processes that endanger the long-term lung development, such as inflammation and immune dysfunction.
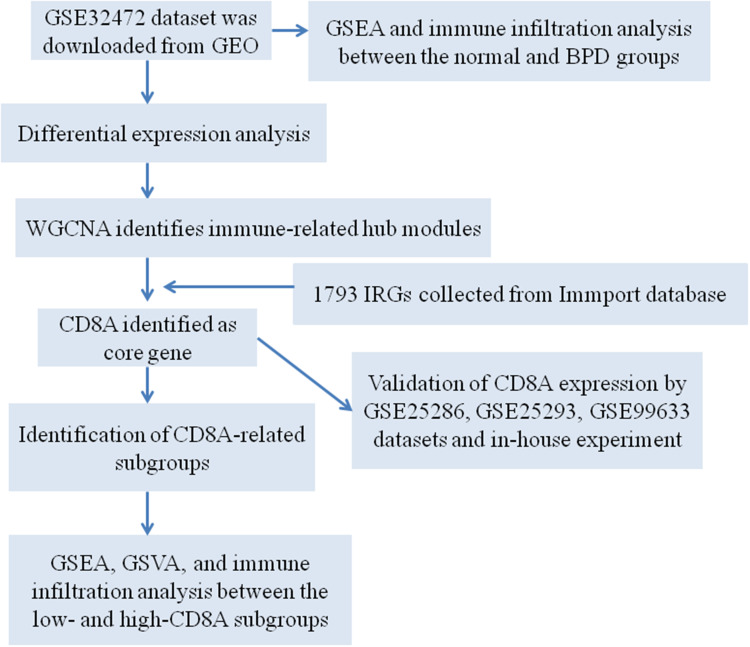
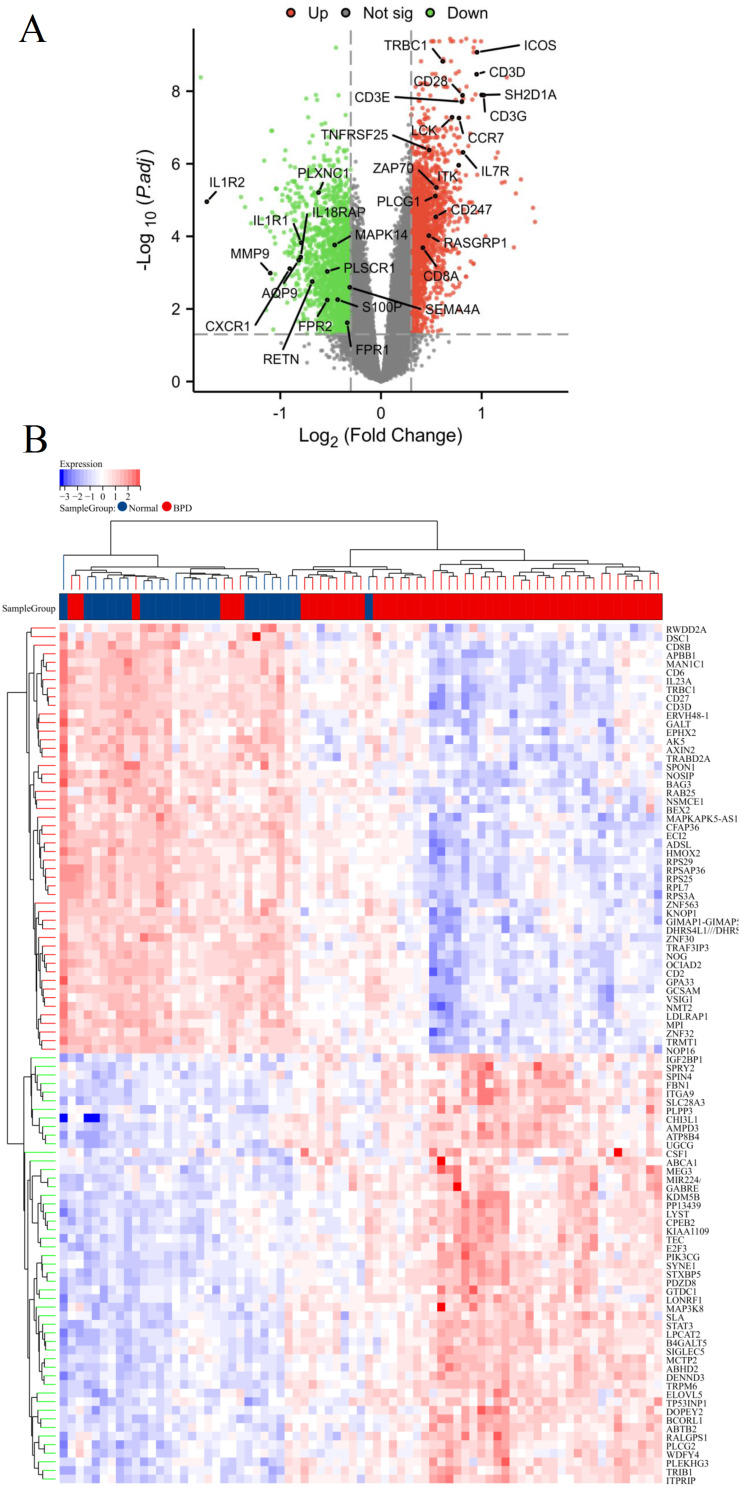
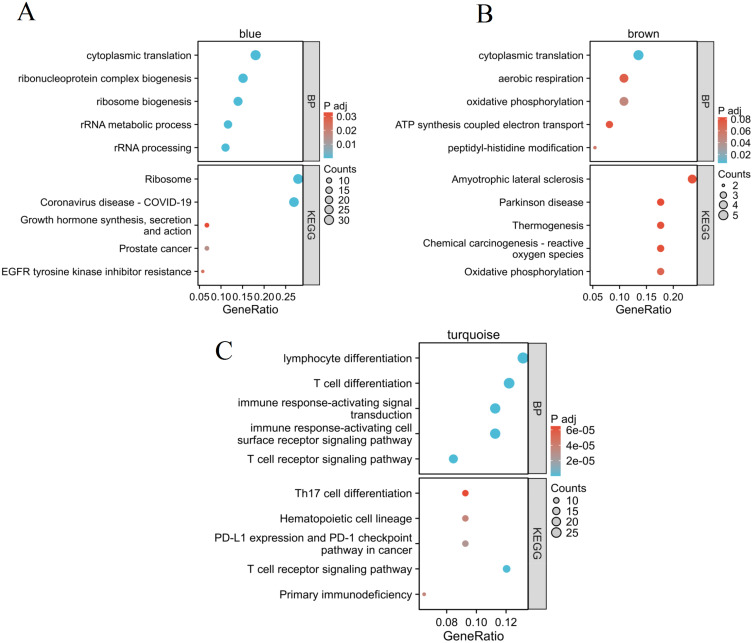
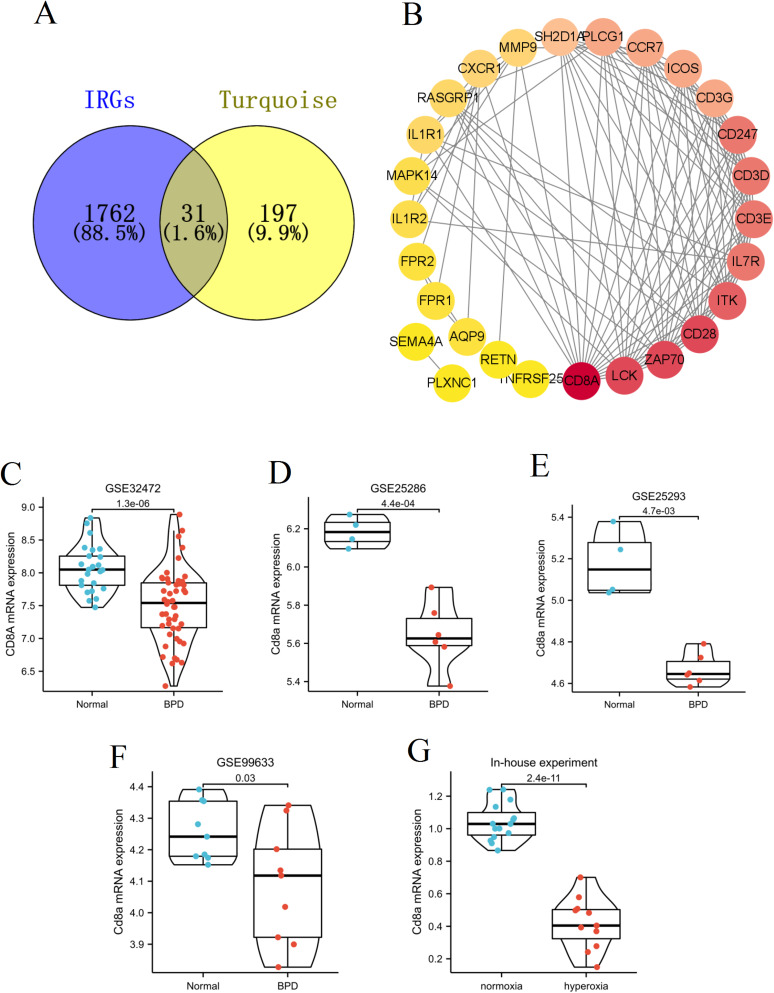
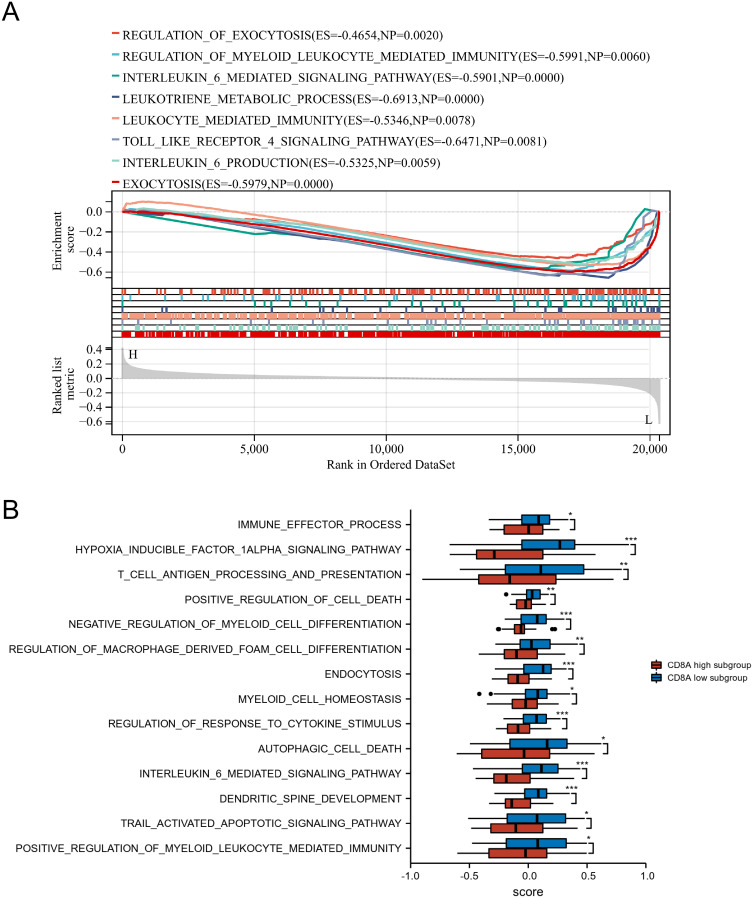
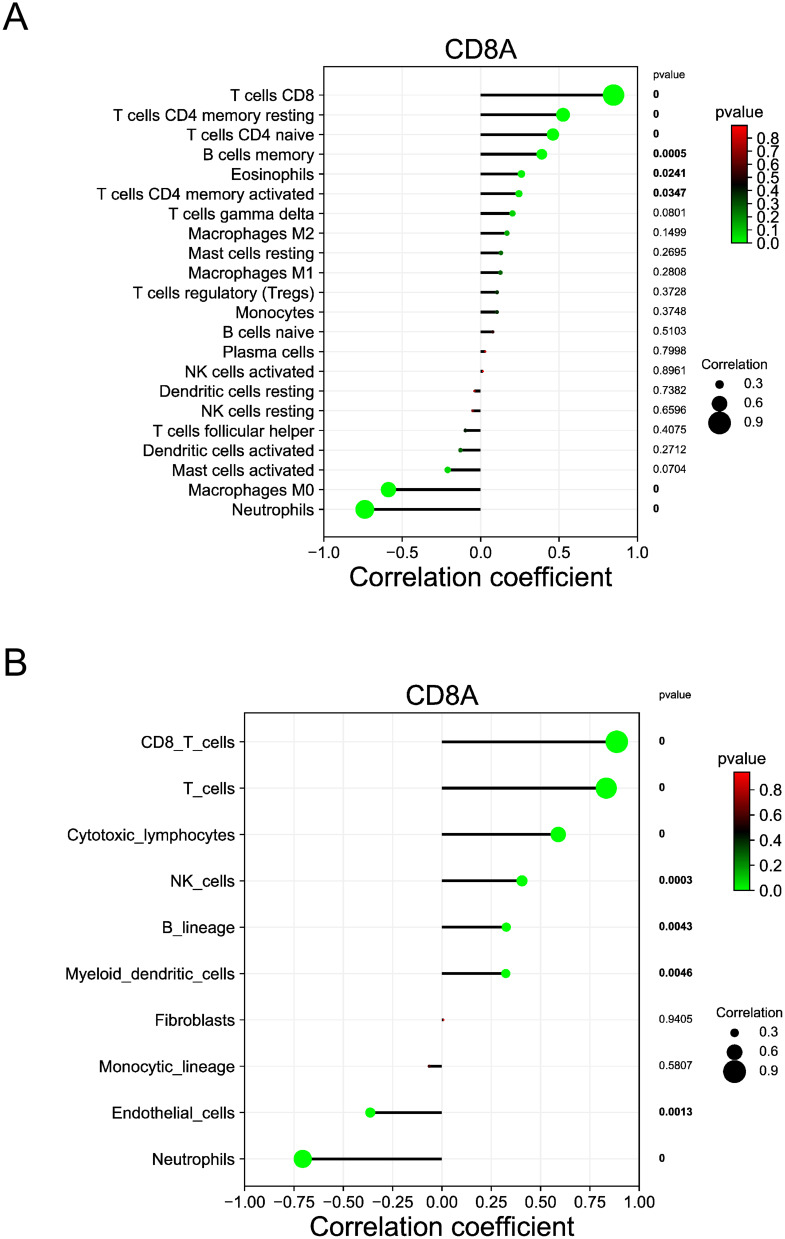
Methods: In this study, a bioinformatics approach was applied to identify the differentially expressed immune-related genes (DEIRGs). We downloaded the transcriptional profiles (GSE32472 dataset) from the Gene Expression Omnibus (GEO) database and performed gene set enrichment analysis (GSEA). Cell type Identification By Estimating Relative Subsets of RNA Transcripts (CIBERSORT), microenvironment cell populations counter (MCPcounter), and Estimation of STromal and Immune cells in Malignant Tumor tissues using Expression data (ESTIMATE) were used for the analysis of the immune cell infiltration landscape of BPD. A weighted co-expression network was subsequently constructed using weighted gene co-expression network analysis (WGCNA) to screen candidate differentially expressed immune related genes (DEIRGs).
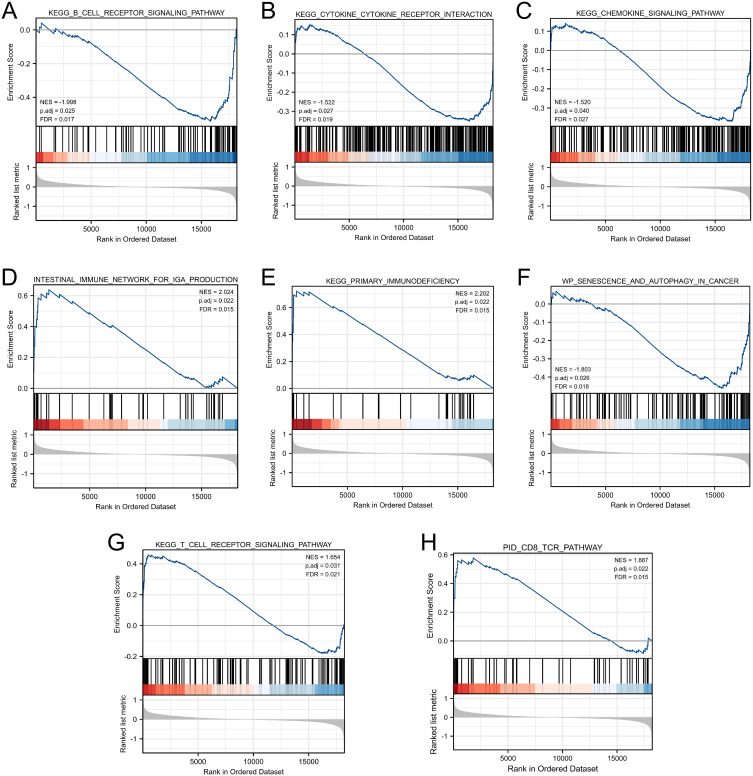
Results: GSEA results indicated that immune-related pathways were mainly involved in BPD. Ten significantly different immune cell types were observed between BPD and normal groups. A total of 228 DEGs in the turquoise module were identified, and 31 DEIRGs were further identified. Cluster of the differentiation 8 alpha (CD8A) expression was down-regulated in BPD, and its expression was validated by the GSE25286, GSE25293, GSE99633 datasets and qRT-PCR. In addition, CD8A expression was closely associated with immune cells infiltration, especially T cells CD8 and neutrophil.
Conclusion: A distinct immune cell infiltration landscape was found between BPD and normal group. CD8A can be a novel candidate biomarker for BPD, which plays an essential role in the onset and progress of hyperoxia-related BPD via the disruption of immune cell functions.
Keywords: CD8A; bronchopulmonary dysplasia; hyperoxia; immunocytes infiltrate; preterm infants.
© 2023 Du et al.
Conflict of interest statement
All authors declared that they have no competing interests.
Figures


Similar articles
-
Machine Learning Identification of Neutrophil Extracellular Trap-Related Genes as Potential Biomarkers and Therapeutic Targets for Bronchopulmonary Dysplasia.Int J Mol Sci. 2025 Mar 31;26(7):3230. doi: 10.3390/ijms26073230. Int J Mol Sci. 2025. PMID: 40244055 Free PMC article.
-
Bioinformatics analyses and experimental validation of ferroptosis-related genes in bronchopulmonary dysplasia pathogenesis.PLoS One. 2024 Jun 14;19(6):e0291583. doi: 10.1371/journal.pone.0291583. eCollection 2024. PLoS One. 2024. PMID: 38875180 Free PMC article.
-
Inflammation-related genes and immune infiltration landscape identified in kainite-induced temporal lobe epilepsy based on integrated bioinformatics analysis.Front Neurosci. 2022 Oct 27;16:996368. doi: 10.3389/fnins.2022.996368. eCollection 2022. Front Neurosci. 2022. PMID: 36389252 Free PMC article.
-
Integrated identification of key immune related genes and patterns of immune infiltration in calcified aortic valvular disease: A network based meta-analysis.Front Genet. 2022 Sep 21;13:971808. doi: 10.3389/fgene.2022.971808. eCollection 2022. Front Genet. 2022. PMID: 36212153 Free PMC article.
-
Surfactant protein D and bronchopulmonary dysplasia: a new way to approach an old problem.Respir Res. 2021 May 8;22(1):141. doi: 10.1186/s12931-021-01738-4. Respir Res. 2021. PMID: 33964929 Free PMC article. Review.
Cited by
-
The fatty acid-related gene signature stratifies poor prognosis patients and characterizes TIME in cutaneous melanoma.J Cancer Res Clin Oncol. 2024 Jan 27;150(2):40. doi: 10.1007/s00432-023-05580-7. J Cancer Res Clin Oncol. 2024. PMID: 38279987 Free PMC article.
-
Joint effects of CD8A and ICOS in Long QT Syndrome (LQTS) and Beckwith-Wiedemann Syndrome (BWS).J Cardiothorac Surg. 2024 Jun 6;19(1):321. doi: 10.1186/s13019-024-02804-w. J Cardiothorac Surg. 2024. PMID: 38845009 Free PMC article.
-
Analysis and validation of necroptosis-related diagnostic biomarkers associated with immune infiltration in bronchopulmonary dysplasia.Front Pediatr. 2025 Jul 15;13:1578628. doi: 10.3389/fped.2025.1578628. eCollection 2025. Front Pediatr. 2025. PMID: 40735606 Free PMC article.
-
Decoding bronchopulmonary dysplasia in premature infants through an epigenetic lens.Front Med (Lausanne). 2025 Apr 3;12:1531169. doi: 10.3389/fmed.2025.1531169. eCollection 2025. Front Med (Lausanne). 2025. PMID: 40248086 Free PMC article. Review.
References
LinkOut - more resources
Full Text Sources
Research Materials
