

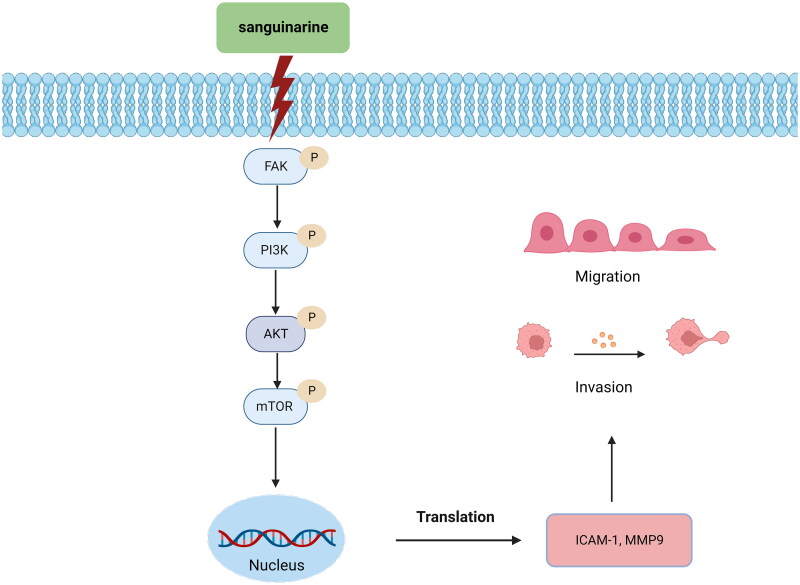
Sanguinarine inhibits melanoma invasion and migration by targeting the FAK/PI3K/AKT/mTOR signalling pathway
- PMID: 37092313
- PMCID: PMC10128503
- DOI: 10.1080/13880209.2023.2200787
Sanguinarine inhibits melanoma invasion and migration by targeting the FAK/PI3K/AKT/mTOR signalling pathway
Erratum in
-
Correction.Pharm Biol. 2023 Dec;61(1):767. doi: 10.1080/13880209.2023.2210885. Pharm Biol. 2023. PMID: 37153987 Free PMC article. No abstract available.
Abstract
Context: Sanguinarine (SAG) is the most abundant constituent of Macleaya cordata (Willd.) R. Br. (Popaceae). SAG has shown antimammary and colorectal metastatic effects in mice in vivo, suggesting its potential for cancer chemotherapy.
Objective: To determine the antimetastatic effect and underlying molecular mechanisms of SAG on melanoma.
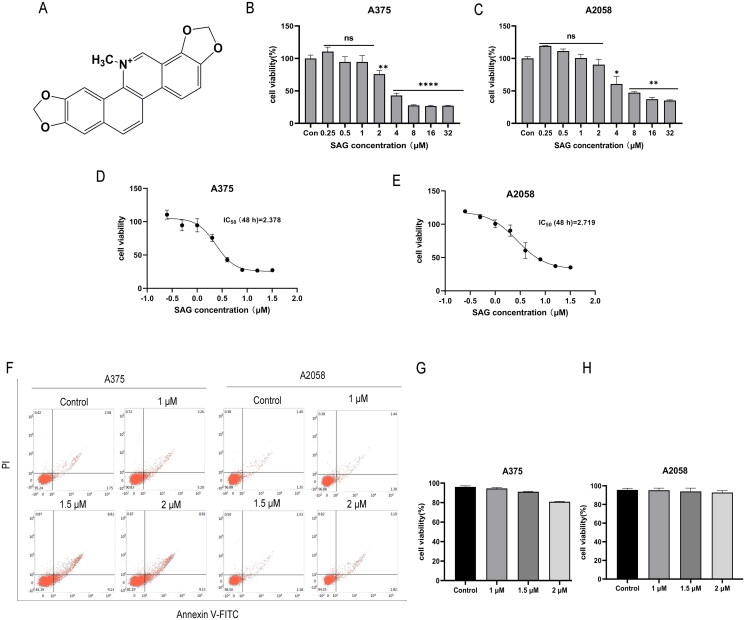
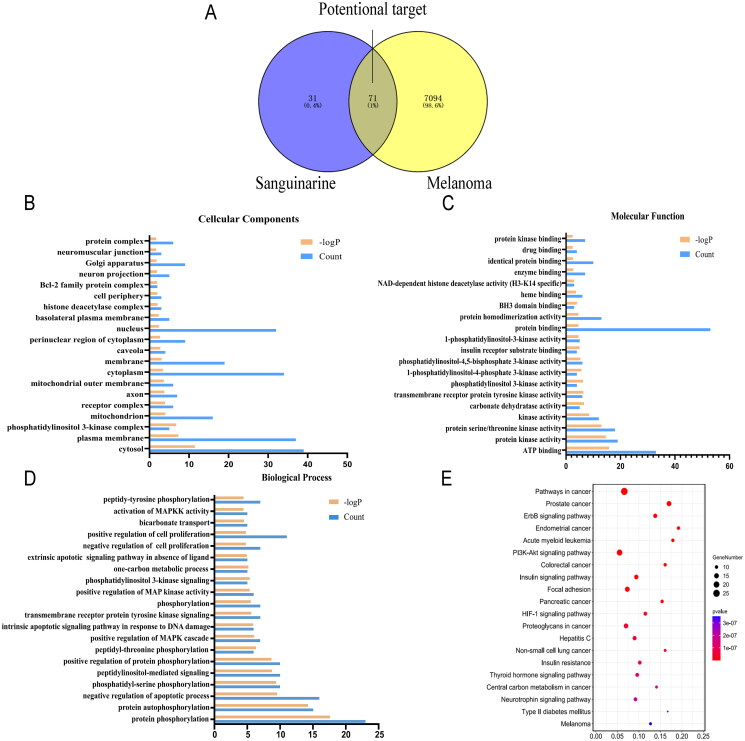
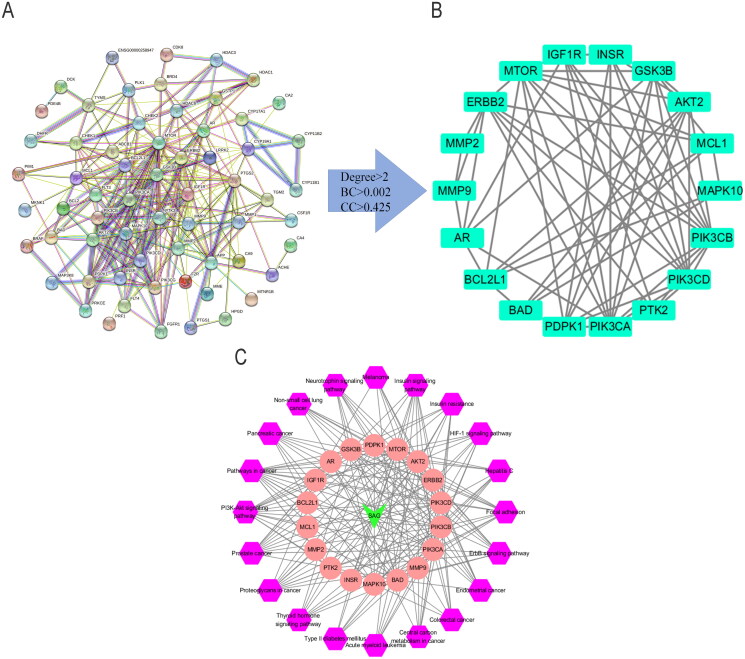
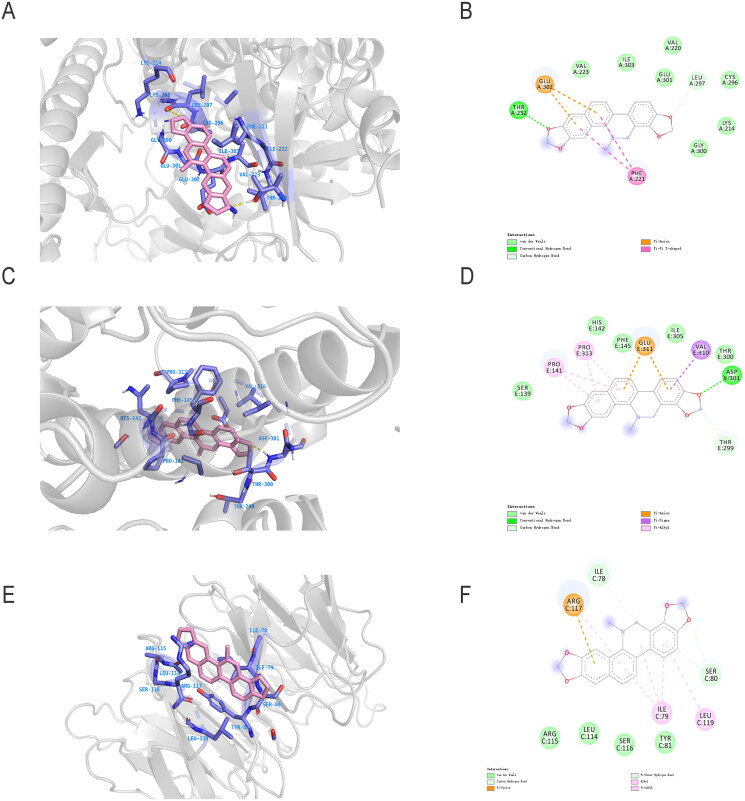
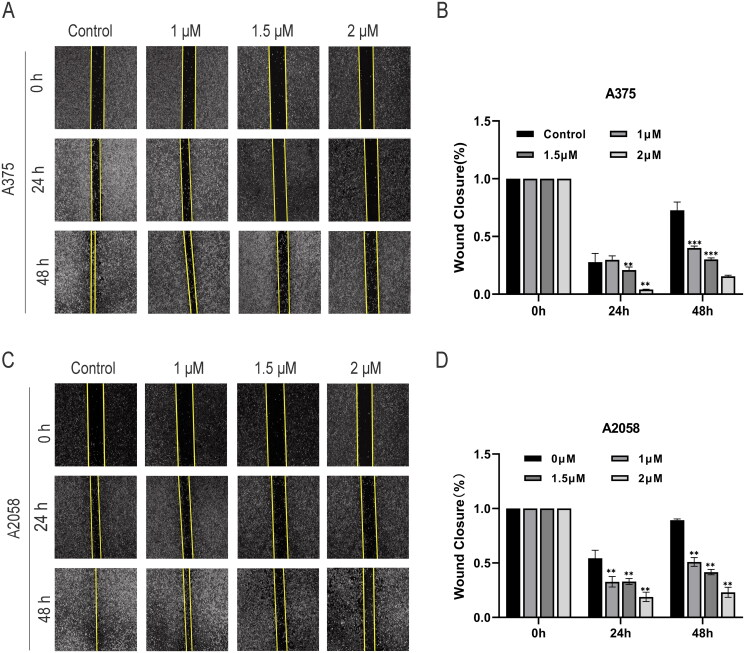
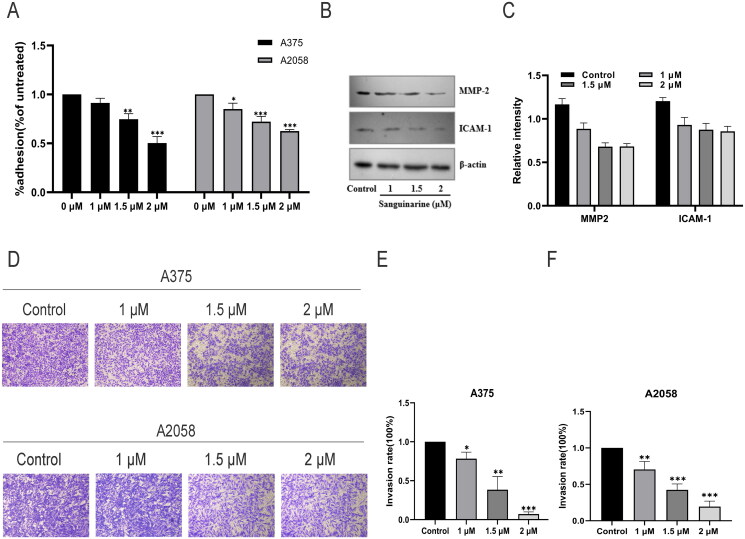
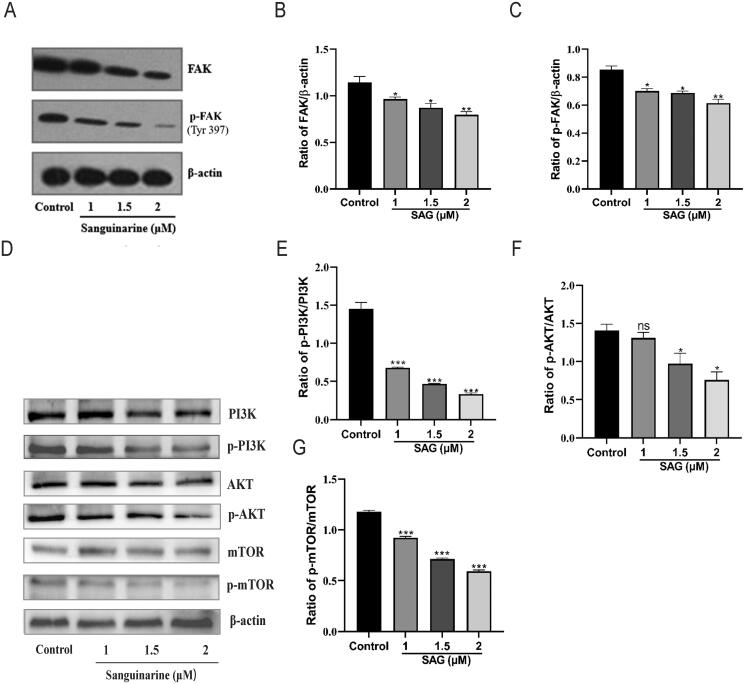
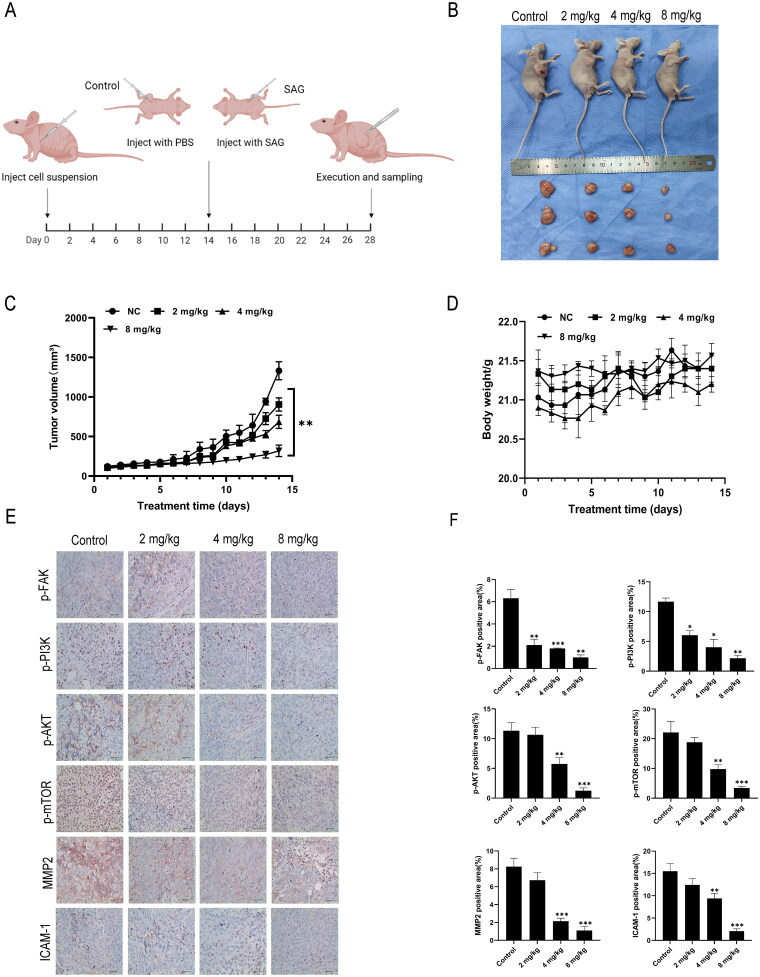
Materials and methods: CCK8 assay was used to determine the inhibition of SAG on the proliferation of A375 and A2058 cells. Network pharmacology analysis was applied to construct a compound-target network and select potential therapeutic targets of SAG against melanoma. Molecular docking simulation was conducted for further analysis of the selected targets. In vitro migration/invasion/western blot assay with 1, 1.5, 2 μM SAG and in vivo effect of 2, 4, 8 mg/kg SAG in xenotransplantation model in nude mice.
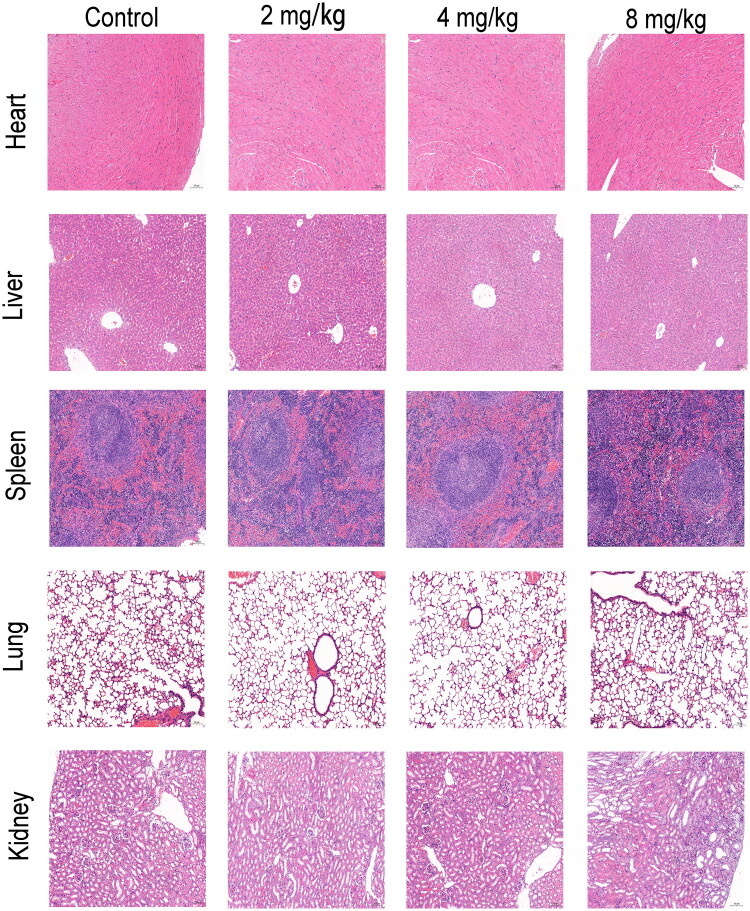
Results: The key targets of SAG treatment for melanoma were mainly enriched in PI3K-AKT pathway, and the binding energy of SAG to PI3K, AKT, and mTOR were -6.33, -6.31, and -6.07 kcal/mol, respectively. SAG treatment inhibited the proliferation, migration, and invasion ability of A375 and A2058 cells (p < 0.05) with IC50 values of 2.378 μM and 2.719 μM, respectively. It also decreased the phosphorylation levels of FAK, PI3K, AKT, mTOR and protein expression levels of MMP2 and ICAM-2. In the nude mouse xenograft model, 2, 4, 8 mg/kg SAG was shown to be effective in inhibiting tumour growth.
Conclusions: Our research offered a theoretical foundation for the clinical antitumor properties of SAG, further suggesting its potential application in the clinic.
Keywords: Network pharmacology; adhesion; metastasis; molecular docking.
Conflict of interest statement
No potential conflict of interest was reported by the author(s).
Figures
Similar articles
-
Polyphyllin I Promoted Melanoma Cells Autophagy and Apoptosis via PI3K/Akt/mTOR Signaling Pathway.Biomed Res Int. 2020 Jul 17;2020:5149417. doi: 10.1155/2020/5149417. eCollection 2020. Biomed Res Int. 2020. PMID: 32733943 Free PMC article.
-
Alpha1-ACT Functions as a Tumour Suppressor in Hepatocellular Carcinoma by Inhibiting the PI3K/AKT/mTOR Signalling Pathway via Activation of PTEN.Cell Physiol Biochem. 2017;41(6):2289-2306. doi: 10.1159/000475648. Epub 2017 Apr 26. Cell Physiol Biochem. 2017. PMID: 28456796
-
Anticancer effects of kaempferol in A375 human malignant melanoma cells are mediated via induction of apoptosis, cell cycle arrest, inhibition of cell migration and downregulation of m-TOR/PI3K/AKT pathway.J BUON. 2018 Jan-Feb;23(1):218-223. J BUON. 2018. PMID: 29552787
-
Luteolin inhibits proliferation and induces apoptosis of human melanoma cells in vivo and in vitro by suppressing MMP-2 and MMP-9 through the PI3K/AKT pathway.Food Funct. 2019 Feb 20;10(2):703-712. doi: 10.1039/c8fo02013b. Food Funct. 2019. PMID: 30663726
-
Network pharmacology, molecular docking and experimental study of CEP in nasopharyngeal carcinoma.J Ethnopharmacol. 2024 Apr 6;323:117667. doi: 10.1016/j.jep.2023.117667. Epub 2023 Dec 28. J Ethnopharmacol. 2024. PMID: 38159821
Cited by
-
Treatment strategies targeting the phosphoinositide 3-kinase/protein kinase B/mechanistic target of rapamycin pathway against triple-negative breast cancer.World J Clin Oncol. 2025 May 24;16(5):104623. doi: 10.5306/wjco.v16.i5.104623. World J Clin Oncol. 2025. PMID: 40503407 Free PMC article. Review.
-
Global trends and emerging insights in BRAF and MEK inhibitor resistance in melanoma: a bibliometric analysis.Front Mol Biosci. 2025 Jan 17;12:1538743. doi: 10.3389/fmolb.2025.1538743. eCollection 2025. Front Mol Biosci. 2025. PMID: 39897423 Free PMC article.
-
Comprehensive systems biology analysis reveals splicing factor contributions to cutaneous melanoma progression.Sci Rep. 2025 Mar 19;15(1):9486. doi: 10.1038/s41598-025-93695-x. Sci Rep. 2025. PMID: 40108329 Free PMC article.
-
Circadian rhythm related genes identified through tumorigenesis and immune infiltration-guided strategies as predictors of prognosis, immunotherapy response, and candidate drugs in skin cutaneous malignant melanoma.Front Immunol. 2025 Mar 21;16:1513750. doi: 10.3389/fimmu.2025.1513750. eCollection 2025. Front Immunol. 2025. PMID: 40191195 Free PMC article.
-
Pentoxifylline and Norcantharidin Synergistically Suppress Melanoma Growth in Mice: A Multi-Modal In Vivo and In Silico Study.Int J Mol Sci. 2025 Aug 4;26(15):7522. doi: 10.3390/ijms26157522. Int J Mol Sci. 2025. PMID: 40806647 Free PMC article.
References
-
- Burgeiro A, Bento AC, Gajate C, Oliveira PJ, Mollinedo F.. 2013. Rapid human melanoma cell death induced by sanguinarine through oxidative stress. Eur J Pharmacol. 705(1-3):109–118. - PubMed
-
- Chen JS, Li HS, Huang JQ, Dong SH, Huang ZJ, Yi W, Zhan GF, Feng JT, Sun JC, Huang XH.. 2016. MicroRNA-379-5p inhibits tumor invasion and metastasis by targeting FAK/AKT signaling in hepatocellular carcinoma. Cancer Lett. 375(1):73–83. - PubMed
-
- De Stefano I, Raspaglio G, Zannoni GF, Travaglia D, Prisco MG, Mosca M, Ferlini C, Scambia G, Gallo D.. 2009. Antiproliferative and antiangiogenic effects of the benzophenanthridine alkaloid sanguinarine in melanoma. Biochem Pharmacol. 78(11):1374–1381. - PubMed
MeSH terms
Substances
LinkOut - more resources
Full Text Sources
Medical
Miscellaneous